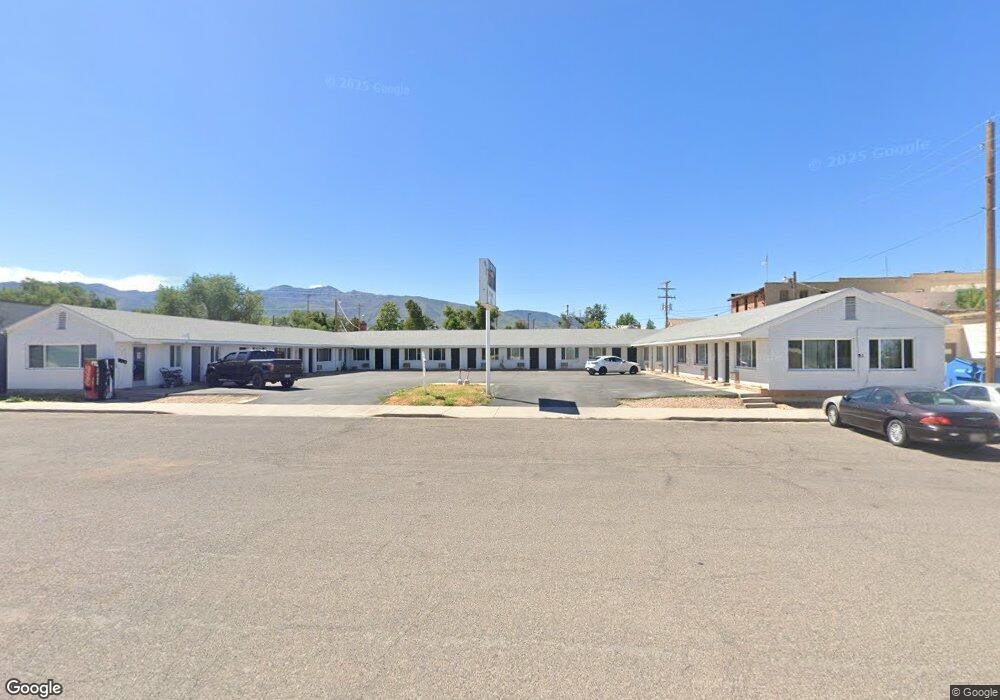
30 E Center St Fillmore, UT 84631
--
Bed
--
Bath
--
Sq Ft
0.33
Acres
About This Home
This home is located at 30 E Center St, Fillmore, UT 84631. 30 E Center St is a home located in Millard County.
Ownership History
Date
Name
Owned For
Owner Type
Purchase Details
Closed on
Feb 17, 2022
Sold by
Heidi Mcnulty
Bought by
Mom Boss Llc
Purchase Details
Closed on
Aug 6, 2021
Sold by
Smith Patricia J and Smith Perry J
Bought by
Mcnulty Heldi
Home Financials for this Owner
Home Financials are based on the most recent Mortgage that was taken out on this home.
Original Mortgage
$770,000
Interest Rate
3%
Mortgage Type
New Conventional
Purchase Details
Closed on
Mar 1, 2016
Sold by
Robinson Phillip B
Bought by
Smith Perry B and Smith Patricia Jean
Home Financials for this Owner
Home Financials are based on the most recent Mortgage that was taken out on this home.
Original Mortgage
$180,000
Interest Rate
3.81%
Mortgage Type
Purchase Money Mortgage
Purchase Details
Closed on
Feb 29, 2016
Sold by
Fuller Eleanor Robison
Bought by
Robison Phillip B
Home Financials for this Owner
Home Financials are based on the most recent Mortgage that was taken out on this home.
Original Mortgage
$180,000
Interest Rate
3.81%
Mortgage Type
Purchase Money Mortgage
Create a Home Valuation Report for This Property
The Home Valuation Report is an in-depth analysis detailing your home's value as well as a comparison with similar homes in the area
Home Values in the Area
Average Home Value in this Area
Purchase History
| Date | Buyer | Sale Price | Title Company |
|---|---|---|---|
| Mom Boss Llc | -- | First American Title | |
| Mcnulty Heldi | -- | Gt Title Services | |
| Mcnulty Heidi | -- | G Title | |
| Smith Perry B | -- | First American Title | |
| Robison Phillip B | -- | First American Title |
Source: Public Records
Mortgage History
| Date | Status | Borrower | Loan Amount |
|---|---|---|---|
| Previous Owner | Mcnulty Heldi | $770,000 | |
| Previous Owner | Smith Perry B | $180,000 |
Source: Public Records
Tax History Compared to Growth
Tax History
| Year | Tax Paid | Tax Assessment Tax Assessment Total Assessment is a certain percentage of the fair market value that is determined by local assessors to be the total taxable value of land and additions on the property. | Land | Improvement |
|---|---|---|---|---|
| 2024 | $2,611 | $224,273 | $21,418 | $202,855 |
| 2023 | $2,234 | $224,273 | $21,418 | $202,855 |
| 2022 | $2,475 | $222,261 | $19,406 | $202,855 |
| 2021 | $2,450 | $211,197 | $19,406 | $191,791 |
| 2020 | $2,436 | $211,197 | $19,406 | $191,791 |
| 2019 | $2,428 | $211,197 | $19,406 | $191,791 |
| 2018 | $2,372 | $211,197 | $19,406 | $191,791 |
| 2017 | $1,788 | $151,351 | $27,550 | $123,801 |
| 2016 | $1,071 | $94,738 | $27,550 | $67,188 |
| 2015 | $1,071 | $94,738 | $27,550 | $67,188 |
| 2014 | -- | $94,738 | $27,550 | $67,188 |
| 2013 | -- | $94,738 | $27,550 | $67,188 |
Source: Public Records
Map
Nearby Homes
- 40 S 100 Rd E
- 60 W 100 N
- 220 S 200 E
- 225 W 200 St N
- 30 E 300 S
- 390 N 100 W
- 380 N 200 St W
- 430 E Canyon Rd
- 190 W 400 St S
- 155 E 500 St S
- 2600 S 400 Rd W
- 335 W 400 North St
- 310 S 600 E
- 405 E 500 St S
- 625 N 100 St E Unit 20
- 690 E 500 S
- 760 E 700 St S
- 410 W 400 N
- 750 800 South Fillmore
- 825 800 South Fillmore