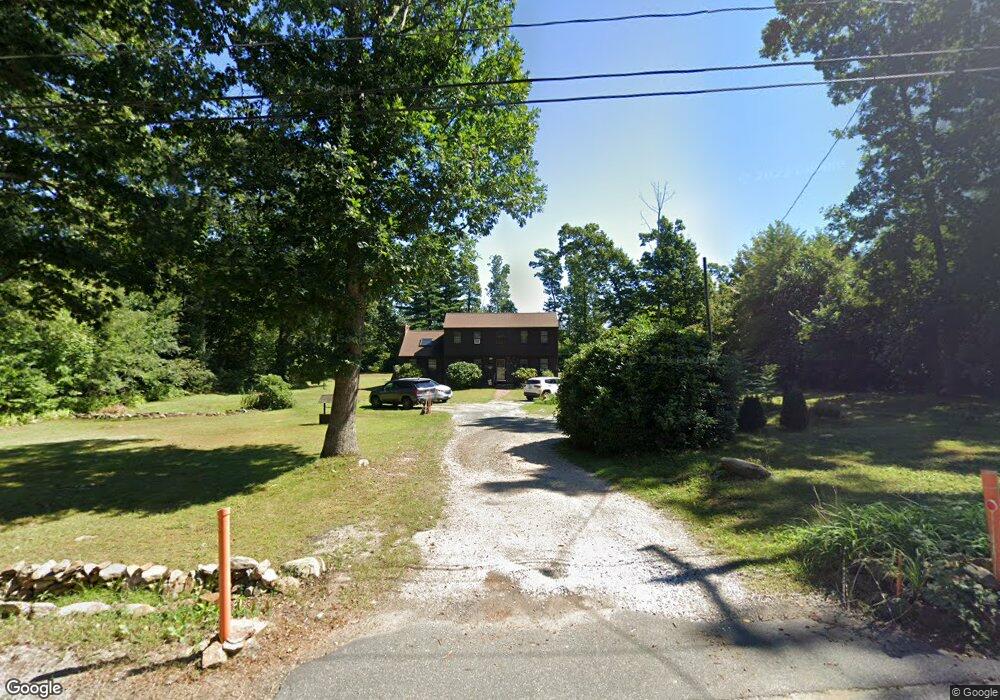
30 E Hill Rd Monson, MA 01057
Estimated Value: $397,000 - $429,000
3
Beds
2
Baths
1,974
Sq Ft
$208/Sq Ft
Est. Value
About This Home
This home is located at 30 E Hill Rd, Monson, MA 01057 and is currently estimated at $410,005, approximately $207 per square foot. 30 E Hill Rd is a home located in Hampden County with nearby schools including Quarry Hill Community School, Granite Valley School, and Monson High School.
Ownership History
Date
Name
Owned For
Owner Type
Purchase Details
Closed on
Nov 5, 2025
Sold by
Raymond Steven P
Bought by
30 East Hill Road Rt and Raymond
Current Estimated Value
Purchase Details
Closed on
Jun 15, 1992
Sold by
Ryan Joseph and Ryan Deborah
Bought by
Raymond Steven P and Raymond Christine M
Home Financials for this Owner
Home Financials are based on the most recent Mortgage that was taken out on this home.
Original Mortgage
$107,200
Interest Rate
8.79%
Mortgage Type
Purchase Money Mortgage
Create a Home Valuation Report for This Property
The Home Valuation Report is an in-depth analysis detailing your home's value as well as a comparison with similar homes in the area
Home Values in the Area
Average Home Value in this Area
Purchase History
| Date | Buyer | Sale Price | Title Company |
|---|---|---|---|
| 30 East Hill Road Rt | -- | -- | |
| Raymond Steven P | $134,000 | -- |
Source: Public Records
Mortgage History
| Date | Status | Borrower | Loan Amount |
|---|---|---|---|
| Previous Owner | Raymond Steven P | $100,000 | |
| Previous Owner | Raymond Steven P | $107,200 | |
| Previous Owner | Raymond Steven P | $10,000 | |
| Previous Owner | Raymond Steven P | $5,000 |
Source: Public Records
Tax History
| Year | Tax Paid | Tax Assessment Tax Assessment Total Assessment is a certain percentage of the fair market value that is determined by local assessors to be the total taxable value of land and additions on the property. | Land | Improvement |
|---|---|---|---|---|
| 2025 | $4,747 | $319,200 | $68,800 | $250,400 |
| 2024 | $4,673 | $301,500 | $68,800 | $232,700 |
| 2023 | $4,677 | $294,900 | $68,800 | $226,100 |
| 2022 | $4,491 | $251,900 | $68,800 | $183,100 |
| 2021 | $4,175 | $230,400 | $68,800 | $161,600 |
| 2020 | $3,270 | $230,400 | $68,800 | $161,600 |
| 2019 | $3,258 | $220,500 | $68,800 | $151,700 |
| 2018 | $3,476 | $223,600 | $76,200 | $147,400 |
| 2017 | $6,941 | $215,400 | $73,100 | $142,300 |
| 2016 | $3,585 | $209,400 | $70,500 | $138,900 |
| 2015 | $3,491 | $209,400 | $70,500 | $138,900 |
| 2014 | $3,392 | $209,400 | $70,500 | $138,900 |
Source: Public Records
Map
Nearby Homes
Your Personal Tour Guide
Ask me questions while you tour the home.