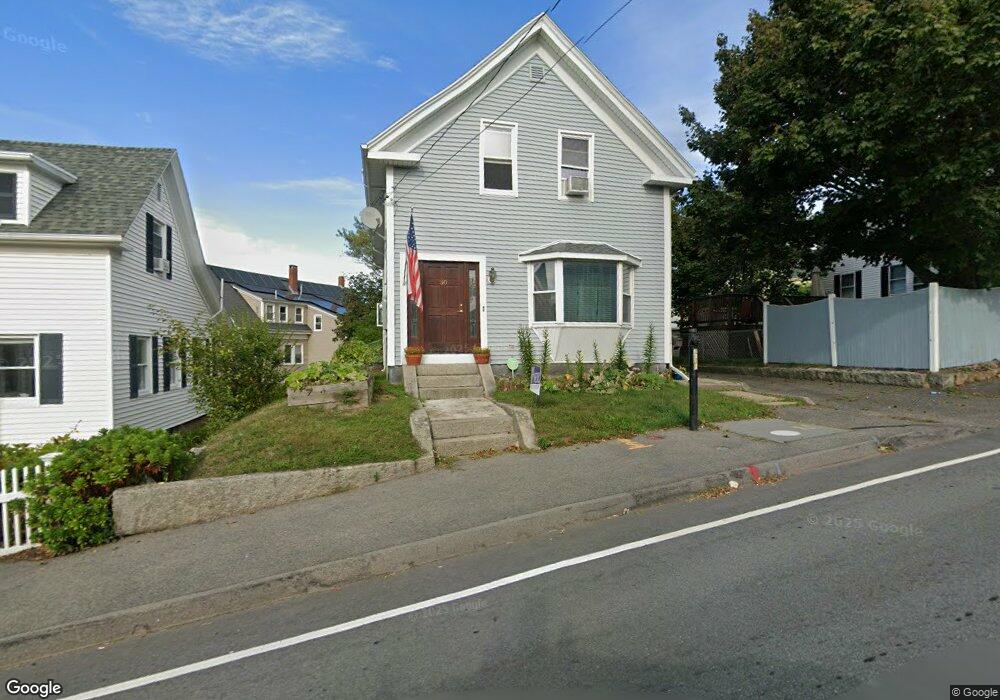
30 E Main St Gloucester, MA 01930
East Gloucester NeighborhoodEstimated Value: $539,000 - $752,000
4
Beds
2
Baths
1,587
Sq Ft
$395/Sq Ft
Est. Value
About This Home
This home is located at 30 E Main St, Gloucester, MA 01930 and is currently estimated at $627,196, approximately $395 per square foot. 30 E Main St is a home located in Essex County with nearby schools including East Gloucester Elementary School, Ralph B O'maley Middle School, and Gloucester High School.
Ownership History
Date
Name
Owned For
Owner Type
Purchase Details
Closed on
Jul 7, 1995
Sold by
Powers Jeffery C and Powers Patricia M
Bought by
Nelson John and Nelson Ruth F
Current Estimated Value
Home Financials for this Owner
Home Financials are based on the most recent Mortgage that was taken out on this home.
Original Mortgage
$127,500
Interest Rate
7.84%
Mortgage Type
Purchase Money Mortgage
Create a Home Valuation Report for This Property
The Home Valuation Report is an in-depth analysis detailing your home's value as well as a comparison with similar homes in the area
Home Values in the Area
Average Home Value in this Area
Purchase History
| Date | Buyer | Sale Price | Title Company |
|---|---|---|---|
| Nelson John | $125,000 | -- |
Source: Public Records
Mortgage History
| Date | Status | Borrower | Loan Amount |
|---|---|---|---|
| Open | Nelson John | $207,000 | |
| Closed | Nelson John | $34,000 | |
| Closed | Nelson John | $127,500 |
Source: Public Records
Tax History
| Year | Tax Paid | Tax Assessment Tax Assessment Total Assessment is a certain percentage of the fair market value that is determined by local assessors to be the total taxable value of land and additions on the property. | Land | Improvement |
|---|---|---|---|---|
| 2025 | $5,403 | $555,900 | $163,500 | $392,400 |
| 2024 | $5,334 | $548,200 | $155,800 | $392,400 |
| 2023 | $5,105 | $482,100 | $139,100 | $343,000 |
| 2022 | $4,945 | $421,600 | $121,000 | $300,600 |
| 2021 | $4,773 | $383,700 | $110,000 | $273,700 |
| 2020 | $4,699 | $381,100 | $110,000 | $271,100 |
| 2019 | $4,482 | $353,200 | $110,000 | $243,200 |
| 2018 | $4,298 | $332,400 | $110,000 | $222,400 |
| 2017 | $4,165 | $315,800 | $104,800 | $211,000 |
| 2016 | $4,054 | $297,900 | $109,300 | $188,600 |
| 2015 | $3,873 | $283,700 | $109,300 | $174,400 |
Source: Public Records
Map
Nearby Homes
- 3 Mondello Square
- 36 Eastern Ave
- 5 Wise Place
- 70 Bass Ave
- 139A Prospect St
- 26 Marina Dr
- 197 E Main St Unit 1
- 19 Trask St Unit 2
- 50 Warner St
- 191 Main St Unit 3
- 191 Main St Unit 2A
- 60 Rocky Neck Ave Unit 202
- 73 Rocky Neck Ave Unit 2
- 113 Pleasant St
- 40 Sargent St
- 33 Maplewood Ave Unit 310
- 70 Old Nugent Farm Rd
- 12 Arthur St
- 1 Wonson St
- 9 Cleveland Place
Your Personal Tour Guide
Ask me questions while you tour the home.