Estimated Value: $133,000 - $227,000
3
Beds
1
Bath
1,388
Sq Ft
$135/Sq Ft
Est. Value
About This Home
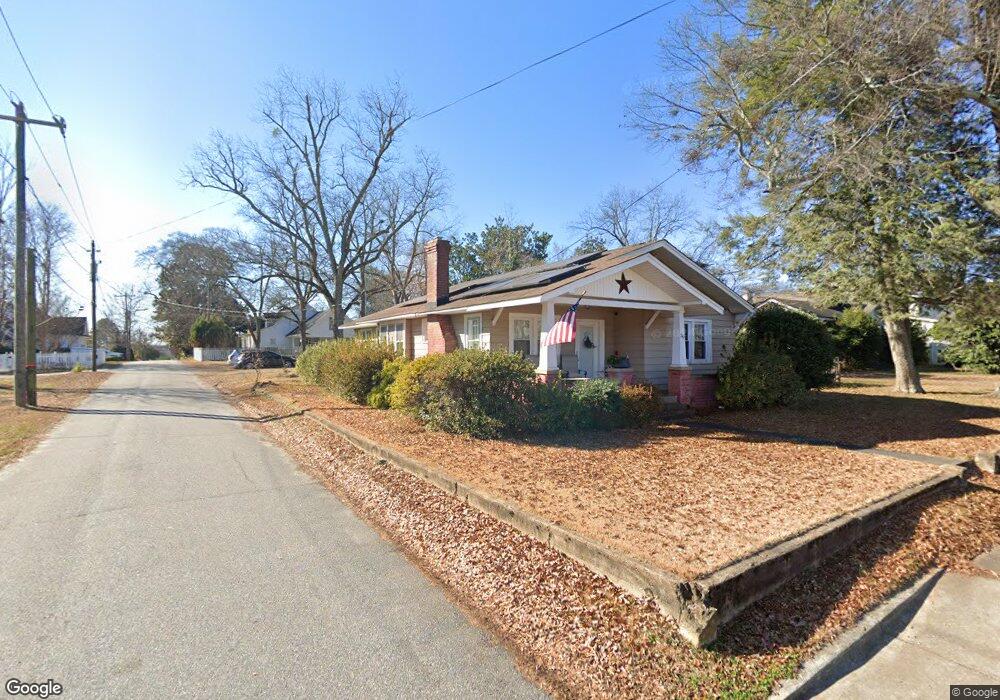
This home is located at 30 E Main St, Inman, SC 29349 and is currently estimated at $187,025, approximately $134 per square foot. 30 E Main St is a home located in Spartanburg County with nearby schools including Inman Elementary School, T.E. Mabry Middle School, and Chapman High School.
Ownership History
Date
Name
Owned For
Owner Type
Purchase Details
Closed on
Jun 4, 2010
Sold by
Miller Thomas J and Miller Laura E
Bought by
Pfister Scott K and Pfister Terilyn M
Current Estimated Value
Home Financials for this Owner
Home Financials are based on the most recent Mortgage that was taken out on this home.
Original Mortgage
$91,270
Outstanding Balance
$61,618
Interest Rate
5.12%
Mortgage Type
FHA
Estimated Equity
$125,407
Purchase Details
Closed on
May 18, 2005
Sold by
Household Finance Corp Ii
Bought by
Miller Thomas J and Miller Laura E
Purchase Details
Closed on
Feb 10, 2005
Sold by
Henderson Howard and Henderson Wendy
Bought by
Mortgage Electronic Registration Systems and Household Mortgage Funding Corp Iii
Purchase Details
Closed on
Sep 16, 2002
Sold by
Dorman Larry G and Dorman Martha J
Bought by
Dorman Larry G and Dorman Martha J
Create a Home Valuation Report for This Property
The Home Valuation Report is an in-depth analysis detailing your home's value as well as a comparison with similar homes in the area
Home Values in the Area
Average Home Value in this Area
Purchase History
| Date | Buyer | Sale Price | Title Company |
|---|---|---|---|
| Pfister Scott K | $92,500 | -- | |
| Miller Thomas J | $38,500 | -- | |
| Household Finance Corp Ii | -- | -- | |
| Mortgage Electronic Registration Systems | $48,944 | -- | |
| Dorman Larry G | -- | -- | |
| Henderson Howard | $54,200 | -- |
Source: Public Records
Mortgage History
| Date | Status | Borrower | Loan Amount |
|---|---|---|---|
| Open | Pfister Scott K | $91,270 |
Source: Public Records
Tax History
| Year | Tax Paid | Tax Assessment Tax Assessment Total Assessment is a certain percentage of the fair market value that is determined by local assessors to be the total taxable value of land and additions on the property. | Land | Improvement |
|---|---|---|---|---|
| 2022 | $1,076 | $4,218 | $535 | $3,683 |
| 2021 | $1,054 | $4,218 | $535 | $3,683 |
| 2020 | $1,029 | $4,218 | $535 | $3,683 |
| 2019 | $1,042 | $4,218 | $535 | $3,683 |
| 2018 | $1,029 | $4,218 | $535 | $3,683 |
| 2017 | $876 | $3,668 | $400 | $3,268 |
| 2016 | $849 | $3,668 | $400 | $3,268 |
| 2015 | $844 | $3,668 | $400 | $3,268 |
| 2014 | $815 | $3,668 | $400 | $3,268 |
Source: Public Records
Map
Nearby Homes
Your Personal Tour Guide
Ask me questions while you tour the home.