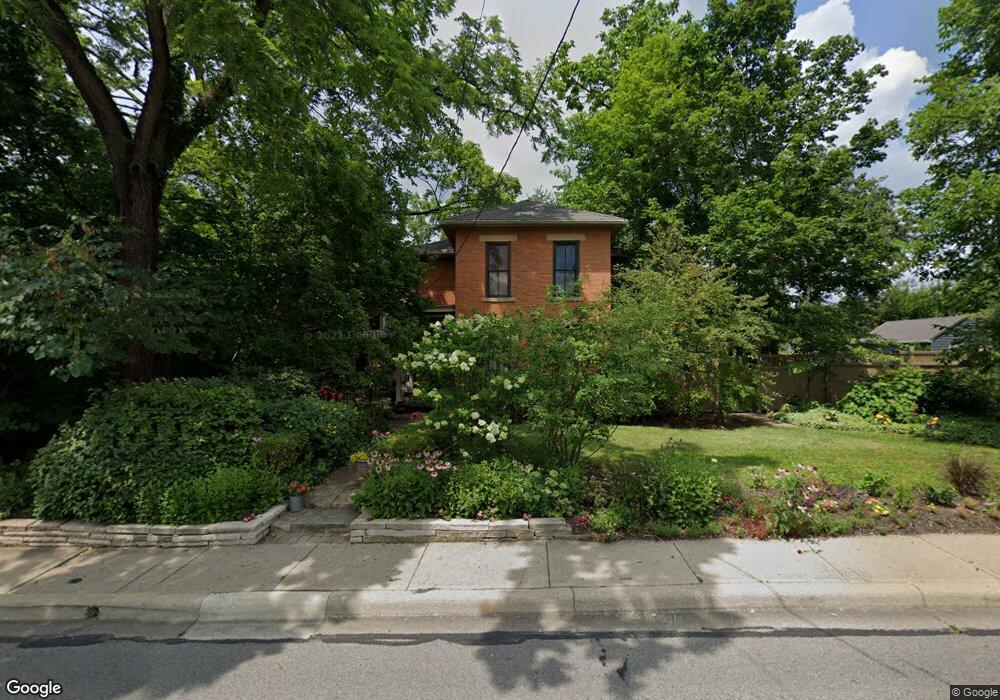
30 E Walnut St Westerville, OH 43081
Estimated Value: $466,000 - $591,885
3
Beds
3
Baths
2,719
Sq Ft
$190/Sq Ft
Est. Value
About This Home
This home is located at 30 E Walnut St, Westerville, OH 43081 and is currently estimated at $515,971, approximately $189 per square foot. 30 E Walnut St is a home located in Franklin County with nearby schools including Whittier Elementary School, Blendon Middle School, and Westerville South High School.
Ownership History
Date
Name
Owned For
Owner Type
Purchase Details
Closed on
Oct 22, 2004
Sold by
Kellar Matthew V
Bought by
Kellar Jacqueline D
Current Estimated Value
Purchase Details
Closed on
Jul 17, 2000
Sold by
Gebhardt Linda D
Bought by
Kellar Matthew V and Kellar Jacqueline D
Home Financials for this Owner
Home Financials are based on the most recent Mortgage that was taken out on this home.
Original Mortgage
$154,200
Outstanding Balance
$52,185
Interest Rate
8.27%
Estimated Equity
$463,786
Purchase Details
Closed on
Nov 17, 1994
Sold by
O'Herron Mary E
Bought by
Gebhardt Stan E and Gebhardt Linda D
Home Financials for this Owner
Home Financials are based on the most recent Mortgage that was taken out on this home.
Original Mortgage
$80,000
Interest Rate
9.5%
Mortgage Type
New Conventional
Create a Home Valuation Report for This Property
The Home Valuation Report is an in-depth analysis detailing your home's value as well as a comparison with similar homes in the area
Home Values in the Area
Average Home Value in this Area
Purchase History
| Date | Buyer | Sale Price | Title Company |
|---|---|---|---|
| Kellar Jacqueline D | -- | -- | |
| Kellar Matthew V | $181,500 | Capcity Title | |
| Gebhardt Stan E | $80,000 | -- |
Source: Public Records
Mortgage History
| Date | Status | Borrower | Loan Amount |
|---|---|---|---|
| Open | Kellar Matthew V | $154,200 | |
| Closed | Gebhardt Stan E | $80,000 |
Source: Public Records
Tax History
| Year | Tax Paid | Tax Assessment Tax Assessment Total Assessment is a certain percentage of the fair market value that is determined by local assessors to be the total taxable value of land and additions on the property. | Land | Improvement |
|---|---|---|---|---|
| 2025 | $10,276 | $180,810 | $60,620 | $120,190 |
| 2024 | $10,276 | $180,810 | $60,620 | $120,190 |
| 2023 | $10,058 | $180,810 | $60,620 | $120,190 |
| 2022 | $11,302 | $155,130 | $59,190 | $95,940 |
| 2021 | $11,397 | $155,130 | $59,190 | $95,940 |
| 2020 | $11,364 | $155,130 | $59,190 | $95,940 |
| 2019 | $10,132 | $130,560 | $59,190 | $71,370 |
| 2018 | $4,966 | $130,560 | $59,190 | $71,370 |
| 2017 | $7,175 | $94,020 | $29,580 | $64,440 |
| 2016 | $8,657 | $103,260 | $27,690 | $75,570 |
| 2015 | $4,192 | $103,260 | $27,690 | $75,570 |
| 2014 | $8,391 | $103,260 | $27,690 | $75,570 |
| 2013 | $3,989 | $98,315 | $26,355 | $71,960 |
Source: Public Records
Map
Nearby Homes
- 133 Illinois Ave
- 328 Myrtle Dr Unit Lot 5
- 348 Myrtle Dr Unit Lot 10
- 337 Myrtle Dr Unit Lot 2
- 334 Myrtle Dr Unit Lot 7
- 342 Myrtle Dr Unit Lot 8
- 344 Myrtle Dr Unit Lot 9
- 480 S State St
- 291 Mohawk Ave
- 291 Pointe Place
- 303 Pointe Place
- 559 Allview Ct
- 355 Nature Trail Unit 355
- 339 Aylesbury Dr S
- 130 Fairdale Ave
- 25 King Arthur Ct
- 448 Crossings Dr Unit 448
- 465 W Schrock Rd
- 144 Brandywine Dr Unit C
- 629 Andrew Ave
- 22 E Walnut St
- 36 E Walnut St
- 44 E Walnut St
- 134 Graphic Way
- 27 E Walnut St
- 31 E Walnut St
- 33 E Walnut St
- 39 E Walnut St
- 47 E Walnut St
- 43 E Walnut St
- 53 E Walnut St
- 126 S State St
- 15 W Walnut St
- 167 S State St
- 57 E Walnut St
- 190 S State St
- 190 S State St Unit D
- 63 E Walnut St
- 63 E Walnut St
- 133 S State St
Your Personal Tour Guide
Ask me questions while you tour the home.