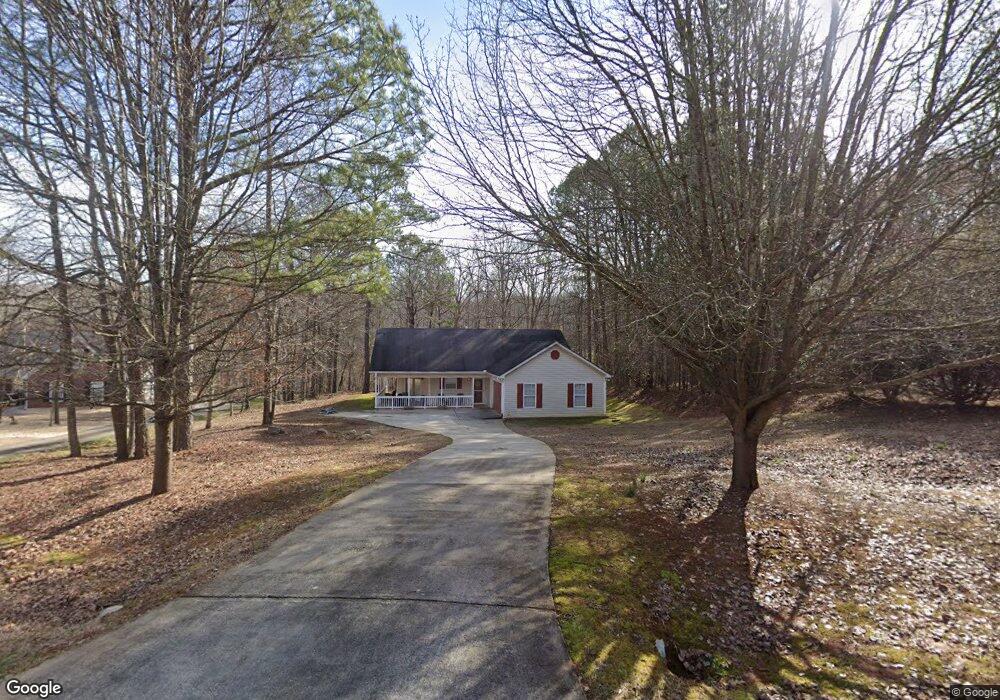
30 Eastwood Terrace Unit B Covington, GA 30014
Estimated Value: $309,000 - $340,000
--
Bed
--
Bath
1,559
Sq Ft
$207/Sq Ft
Est. Value
About This Home
This home is located at 30 Eastwood Terrace Unit B, Covington, GA 30014 and is currently estimated at $321,999, approximately $206 per square foot. 30 Eastwood Terrace Unit B is a home located in Newton County with nearby schools including Flint Hill Elementary School, Cousins Middle School, and Eastside High School.
Ownership History
Date
Name
Owned For
Owner Type
Purchase Details
Closed on
Feb 28, 2018
Sold by
Dabney Timothy Carl
Bought by
Taylor Charlyn Renee
Current Estimated Value
Home Financials for this Owner
Home Financials are based on the most recent Mortgage that was taken out on this home.
Original Mortgage
$131,554
Outstanding Balance
$112,705
Interest Rate
4.37%
Mortgage Type
FHA
Estimated Equity
$209,294
Purchase Details
Closed on
Feb 21, 2013
Sold by
Secretary Of Housing And U
Bought by
Dabney Timothy Carl
Home Financials for this Owner
Home Financials are based on the most recent Mortgage that was taken out on this home.
Original Mortgage
$79,263
Interest Rate
3.5%
Mortgage Type
FHA
Purchase Details
Closed on
Nov 1, 2012
Sold by
Branch Banking And Trust C
Bought by
Secretary Of Housing And Urban
Purchase Details
Closed on
Nov 1, 2011
Sold by
Bowen Wyman A
Bought by
Branch Banking And Trust Co
Create a Home Valuation Report for This Property
The Home Valuation Report is an in-depth analysis detailing your home's value as well as a comparison with similar homes in the area
Home Values in the Area
Average Home Value in this Area
Purchase History
| Date | Buyer | Sale Price | Title Company |
|---|---|---|---|
| Taylor Charlyn Renee | $134,500 | -- | |
| Dabney Timothy Carl | $75,000 | -- | |
| Secretary Of Housing And Urban | $139,553 | -- | |
| Branch Banking And Trust Co | $139,553 | -- |
Source: Public Records
Mortgage History
| Date | Status | Borrower | Loan Amount |
|---|---|---|---|
| Open | Taylor Charlyn Renee | $131,554 | |
| Previous Owner | Dabney Timothy Carl | $79,263 |
Source: Public Records
Tax History Compared to Growth
Tax History
| Year | Tax Paid | Tax Assessment Tax Assessment Total Assessment is a certain percentage of the fair market value that is determined by local assessors to be the total taxable value of land and additions on the property. | Land | Improvement |
|---|---|---|---|---|
| 2024 | $2,707 | $109,000 | $18,000 | $91,000 |
| 2023 | $2,811 | $105,880 | $11,200 | $94,680 |
| 2022 | $2,350 | $89,400 | $11,200 | $78,200 |
| 2021 | $2,072 | $71,240 | $11,200 | $60,040 |
| 2020 | $1,951 | $61,960 | $11,200 | $50,760 |
| 2019 | $1,955 | $61,200 | $11,200 | $50,000 |
| 2018 | $2,249 | $65,520 | $11,200 | $54,320 |
| 2017 | $2,064 | $60,120 | $8,000 | $52,120 |
| 2016 | $1,498 | $43,640 | $6,000 | $37,640 |
| 2015 | $1,438 | $41,880 | $6,000 | $35,880 |
| 2014 | $1,027 | $41,880 | $0 | $0 |
Source: Public Records
Map
Nearby Homes
- 180 River Meadow Ln
- 45 Bridgemill Dr
- 115 River Meadow Ln
- 235 Alcovy Way
- 220 Tamea Trail
- 115 Alcovy Cir
- 125 Kay Cir
- 240 River Cove Meadows
- 66 Dogwood Ln
- 65 Dogwood Ln
- 190 River Cove Meadows
- 595 Ridgeway Rd
- 150 Newton Ridge Dr
- 40 Tall Oak Trail
- 110 Cove Ln
- 460 Dixie Rd
- 316 Elks Club Rd
- 1455 River Cove Rd
- 269 Georgia 11
- 45 Riverbend Dr
- 30 Eastwood Terrace
- 40 Eastwood Terrace
- 225 Eastwood Forest
- 50 Eastwood Terrace
- 45 Eastwood Terrace
- 15 Eastwood Terrace
- 25 Eastwood Terrace Unit 2
- 35 Eastwood Terrace
- 0 Eastwood Forest Unit 8731171
- 0 Eastwood Forest Unit 8670485
- 0 Eastwood Forest Unit 8485251
- 0 Eastwood Forest Unit 8435069
- 0 Eastwood Forest Unit 7562674
- 0 Eastwood Forest Unit 3171460
- 0 Eastwood Forest Unit 7410622
- 0 Eastwood Forest Unit 7343473
- 0 Eastwood Forest Unit 8819570
- 0 Eastwood Forest Unit 8920708
- 0 Eastwood Forest Unit 3123234
- 0 Eastwood Forest Unit 3170886