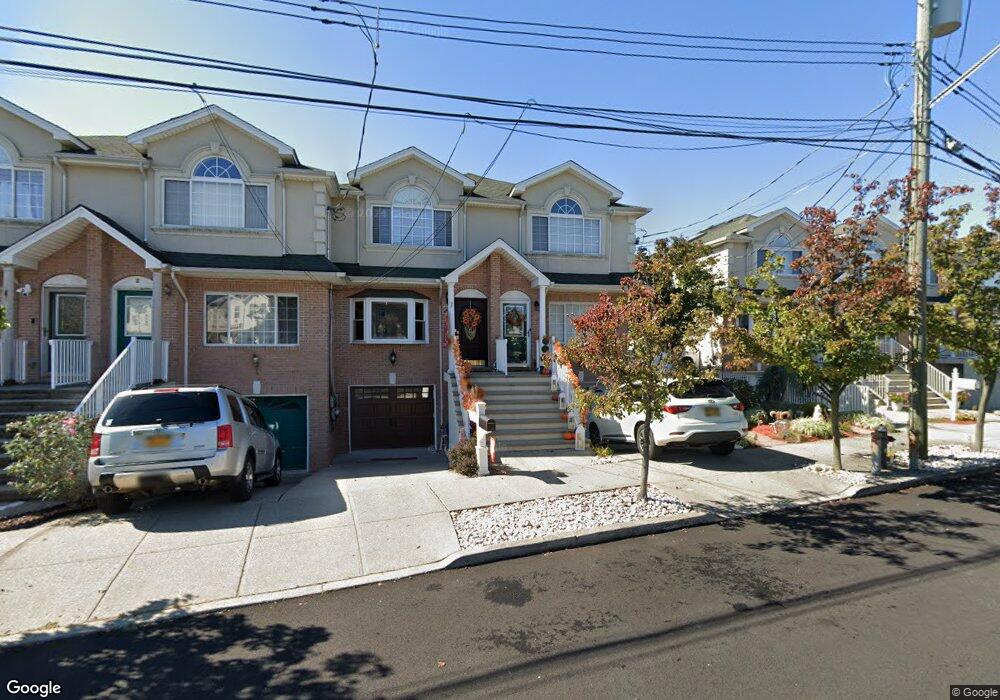
30 Endview St Staten Island, NY 10312
Annadale NeighborhoodEstimated Value: $728,593 - $763,000
3
Beds
4
Baths
1,816
Sq Ft
$413/Sq Ft
Est. Value
About This Home
This home is located at 30 Endview St, Staten Island, NY 10312 and is currently estimated at $750,398, approximately $413 per square foot. 30 Endview St is a home located in Richmond County with nearby schools including P.S. 36 - J.C. Drumgoole, I.S. 007 Elias Bernstein, and Tottenville High School.
Ownership History
Date
Name
Owned For
Owner Type
Purchase Details
Closed on
Apr 15, 2004
Sold by
Larocca Brothers Corp
Bought by
Bannon Patrick and Bannon Nancy
Current Estimated Value
Home Financials for this Owner
Home Financials are based on the most recent Mortgage that was taken out on this home.
Original Mortgage
$322,700
Interest Rate
6.25%
Mortgage Type
Purchase Money Mortgage
Create a Home Valuation Report for This Property
The Home Valuation Report is an in-depth analysis detailing your home's value as well as a comparison with similar homes in the area
Home Values in the Area
Average Home Value in this Area
Purchase History
| Date | Buyer | Sale Price | Title Company |
|---|---|---|---|
| Bannon Patrick | $354,994 | First American Title Insuran |
Source: Public Records
Mortgage History
| Date | Status | Borrower | Loan Amount |
|---|---|---|---|
| Previous Owner | Bannon Patrick | $322,700 |
Source: Public Records
Tax History Compared to Growth
Tax History
| Year | Tax Paid | Tax Assessment Tax Assessment Total Assessment is a certain percentage of the fair market value that is determined by local assessors to be the total taxable value of land and additions on the property. | Land | Improvement |
|---|---|---|---|---|
| 2025 | $7,027 | $41,160 | $5,087 | $36,073 |
| 2024 | $7,027 | $38,520 | $5,395 | $33,125 |
| 2023 | $6,703 | $33,005 | $5,228 | $27,777 |
| 2022 | $6,216 | $34,920 | $5,940 | $28,980 |
| 2021 | $6,182 | $33,600 | $5,940 | $27,660 |
| 2020 | $5,922 | $32,460 | $5,940 | $26,520 |
| 2019 | $5,806 | $30,660 | $5,940 | $24,720 |
| 2018 | $5,309 | $27,504 | $5,806 | $21,698 |
| 2017 | $4,990 | $25,948 | $5,892 | $20,056 |
| 2016 | $4,584 | $24,480 | $5,940 | $18,540 |
| 2015 | $4,370 | $25,440 | $5,400 | $20,040 |
| 2014 | $4,370 | $24,358 | $5,028 | $19,330 |
Source: Public Records
Map
Nearby Homes