Estimated Value: $215,288 - $255,000
--
Bed
1
Bath
1,758
Sq Ft
$133/Sq Ft
Est. Value
About This Home
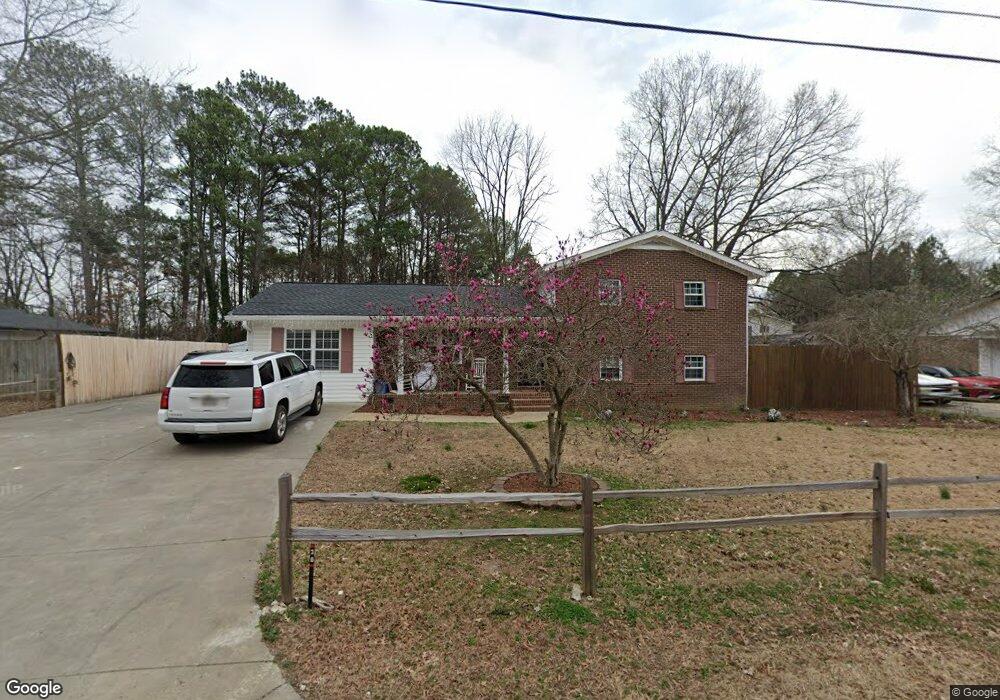
This home is located at 30 Fairhaven Dr NW, Rome, GA 30165 and is currently estimated at $233,072, approximately $132 per square foot. 30 Fairhaven Dr NW is a home located in Floyd County with nearby schools including Coosa Middle School and Coosa High School.
Ownership History
Date
Name
Owned For
Owner Type
Purchase Details
Closed on
Sep 12, 2023
Sold by
Bradfield Robert
Bought by
Bradfield Annell
Current Estimated Value
Purchase Details
Closed on
Dec 22, 2005
Sold by
Edwards Patricia A
Bought by
Bradfield James A
Home Financials for this Owner
Home Financials are based on the most recent Mortgage that was taken out on this home.
Original Mortgage
$90,720
Outstanding Balance
$1,960
Interest Rate
6.19%
Mortgage Type
New Conventional
Estimated Equity
$231,112
Purchase Details
Closed on
Oct 16, 1998
Sold by
Edwards Patricia A and Edwards Tony L
Bought by
Edwards Patricia A
Purchase Details
Closed on
Mar 29, 1995
Sold by
Edwards Patricia A
Bought by
Edwards Patricia A and Edwards Tony L
Purchase Details
Closed on
May 9, 1977
Sold by
Milne Dale G
Bought by
Phillips Mike
Purchase Details
Closed on
Jul 6, 1976
Sold by
Elder Jon C
Bought by
Milne Dale G
Purchase Details
Closed on
Nov 27, 1970
Sold by
Kiser Roy C
Bought by
Elder Jon C
Purchase Details
Closed on
Jul 11, 1969
Sold by
Bishop Robert Edward
Bought by
Kiser Roy C
Purchase Details
Closed on
Oct 18, 1968
Sold by
Smith Bittenbrine Inc
Bought by
Bishop Robert Edward
Purchase Details
Closed on
Jan 1, 1901
Bought by
Smith Bittenbrine Inc
Create a Home Valuation Report for This Property
The Home Valuation Report is an in-depth analysis detailing your home's value as well as a comparison with similar homes in the area
Home Values in the Area
Average Home Value in this Area
Purchase History
| Date | Buyer | Sale Price | Title Company |
|---|---|---|---|
| Bradfield Annell | $144,308 | -- | |
| Bradfield Annell | $144,308 | -- | |
| Bradfield James A | $113,400 | -- | |
| Edwards Patricia A | -- | -- | |
| Edwards Patricia A | -- | -- | |
| Edwards Patricia A | $62,500 | -- | |
| Phillips Mike | $34,900 | -- | |
| Milne Dale G | $34,900 | -- | |
| Elder Jon C | $4,400 | -- | |
| Kiser Roy C | $1,800 | -- | |
| Bishop Robert Edward | $19,000 | -- | |
| Smith Bittenbrine Inc | -- | -- |
Source: Public Records
Mortgage History
| Date | Status | Borrower | Loan Amount |
|---|---|---|---|
| Open | Bradfield James A | $90,720 |
Source: Public Records
Tax History Compared to Growth
Tax History
| Year | Tax Paid | Tax Assessment Tax Assessment Total Assessment is a certain percentage of the fair market value that is determined by local assessors to be the total taxable value of land and additions on the property. | Land | Improvement |
|---|---|---|---|---|
| 2024 | $2,670 | $72,380 | $7,200 | $65,180 |
| 2023 | $2,134 | $68,772 | $6,400 | $62,372 |
| 2022 | $1,777 | $57,723 | $5,200 | $52,523 |
| 2021 | $1,588 | $50,564 | $5,200 | $45,364 |
| 2020 | $1,394 | $43,866 | $4,000 | $39,866 |
| 2019 | $1,325 | $42,281 | $4,000 | $38,281 |
| 2018 | $1,275 | $40,632 | $4,000 | $36,632 |
| 2017 | $1,255 | $39,860 | $4,000 | $35,860 |
| 2016 | $1,258 | $39,472 | $4,000 | $35,472 |
| 2015 | $1,286 | $40,072 | $4,000 | $36,072 |
| 2014 | $1,286 | $41,249 | $4,000 | $37,249 |
Source: Public Records
Map
Nearby Homes
- 4485 Alabama Hwy
- 8 Kayla Dr NW
- 10 Nest Dr NW
- 48 Atwood Dr NW
- 1 Ann Dr NW
- 4813 Alabama Hwy SW
- 43 Brownlow Dr NW
- 293 N Avery Rd NW
- 5 Red Fox Dr SW
- 33 Cedar Ln NW
- 31 Cedar Ln NW
- 45 Albert Ave NW
- 86 N Avery Rd NW
- 775 Mays Bridge Rd SW
- 0 Alabama Hwy Unit 10590171
- 0 Alabama Hwy Unit 7635346
- 0 Alabama Hwy Unit 7494552
- 26 Red Fox Dr SW
- 87 Northside Dr NW
- 458 Kraftsman Rd SW
- 28 Fairhaven Dr NW
- 32 Fairhaven Dr NW
- 0 Fairhaven Dr NW Unit 3190512
- 0 Fairhaven Dr NW Unit 3175464
- 0 Fairhaven Dr NW Unit 8848662
- 0 Fairhaven Dr NW Unit 8663681
- 0 Fairhaven Dr NW Unit 8592922
- 0 Fairhaven Dr NW Unit 8526912
- 0 Fairhaven Dr NW Unit 8346649
- 0 Fairhaven Dr NW Unit 7579810
- 4544 Alabama Hwy NW
- 7 Leisure Dr NW
- 31 Fairhaven Dr NW
- 26 Fairhaven Dr NW
- 29 Fairhaven Dr NW
- 27 Fairhaven Dr NW
- 33 Fairhaven Dr NW
- 2 Lake Park Dr NW
- 4 Lake Park Dr NW
- 11 Leisure Dr NW