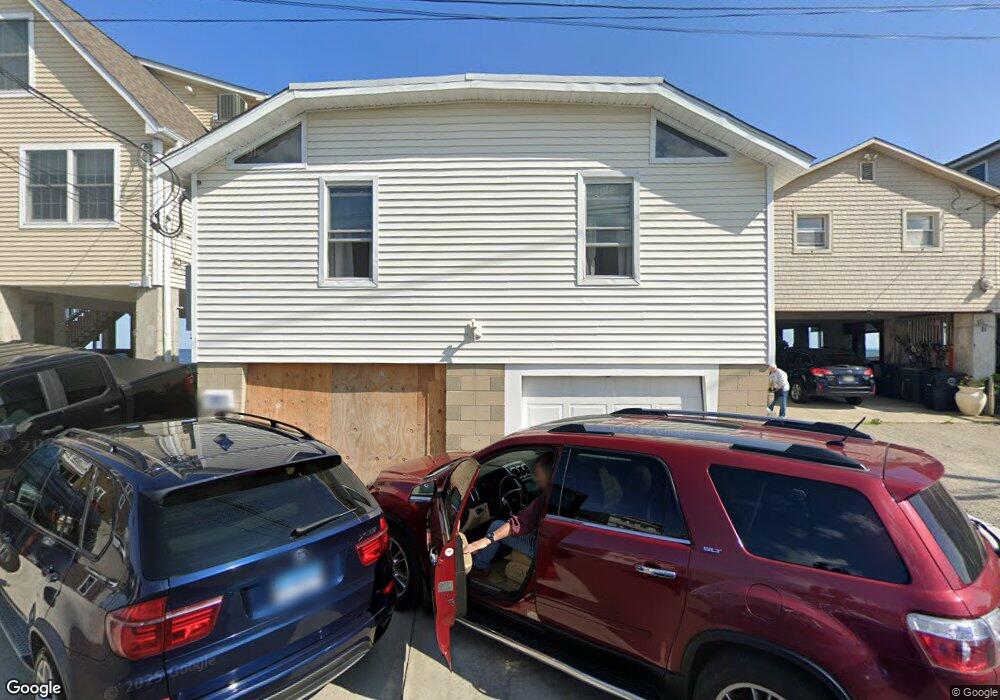
30 Field Ct Unit 1/2 Milford, CT 06460
Woodmont NeighborhoodEstimated Value: $697,000 - $1,136,000
2
Beds
1
Bath
468
Sq Ft
$2,116/Sq Ft
Est. Value
About This Home
This home is located at 30 Field Ct Unit 1/2, Milford, CT 06460 and is currently estimated at $990,417, approximately $2,116 per square foot. 30 Field Ct Unit 1/2 is a home located in New Haven County with nearby schools including Calf Pen Meadow Elementary School, East Shore Middle School, and Joseph A. Foran High School.
Ownership History
Date
Name
Owned For
Owner Type
Purchase Details
Closed on
Jul 25, 2024
Sold by
S G & P H Englander Ret and Ventricelli
Bought by
Field Court Ret and Williston
Current Estimated Value
Home Financials for this Owner
Home Financials are based on the most recent Mortgage that was taken out on this home.
Original Mortgage
$716,667
Outstanding Balance
$708,542
Interest Rate
6.86%
Mortgage Type
Purchase Money Mortgage
Estimated Equity
$281,875
Purchase Details
Closed on
Jun 13, 2018
Sold by
Bayview Beach Asset Mg
Bought by
Patricia H Englander R
Purchase Details
Closed on
Dec 17, 1979
Bought by
Englander Patricia A
Create a Home Valuation Report for This Property
The Home Valuation Report is an in-depth analysis detailing your home's value as well as a comparison with similar homes in the area
Home Values in the Area
Average Home Value in this Area
Purchase History
| Date | Buyer | Sale Price | Title Company |
|---|---|---|---|
| Field Court Ret | $1,000,000 | None Available | |
| Field Court Ret | $1,000,000 | None Available | |
| Patricia H Englander R | -- | -- | |
| Patricia H Englander R H | -- | -- | |
| Englander Patricia A | -- | -- | |
| Patricia H Englander R H | -- | -- |
Source: Public Records
Mortgage History
| Date | Status | Borrower | Loan Amount |
|---|---|---|---|
| Open | Field Court Ret | $716,667 | |
| Closed | Field Court Ret | $716,667 |
Source: Public Records
Tax History Compared to Growth
Tax History
| Year | Tax Paid | Tax Assessment Tax Assessment Total Assessment is a certain percentage of the fair market value that is determined by local assessors to be the total taxable value of land and additions on the property. | Land | Improvement |
|---|---|---|---|---|
| 2025 | $15,816 | $535,230 | $365,400 | $169,830 |
| 2024 | $15,597 | $535,230 | $365,400 | $169,830 |
| 2023 | $14,542 | $535,230 | $365,400 | $169,830 |
| 2022 | $14,264 | $535,230 | $365,400 | $169,830 |
| 2021 | $11,576 | $418,670 | $261,800 | $156,870 |
| 2020 | $11,589 | $418,670 | $261,800 | $156,870 |
| 2019 | $11,601 | $418,670 | $261,800 | $156,870 |
| 2018 | $7,397 | $266,640 | $235,620 | $31,020 |
| 2017 | $7,747 | $278,760 | $235,620 | $43,140 |
| 2016 | $10,040 | $360,640 | $319,200 | $41,440 |
| 2015 | $10,055 | $360,640 | $319,200 | $41,440 |
| 2014 | $9,817 | $360,640 | $319,200 | $41,440 |
Source: Public Records
Map
Nearby Homes
- 26 Deerfield Ave
- 39 Point Lookout
- 7 Orland St
- 288 Welchs Point Rd
- 25 Summer Place
- 590 Gulf St
- 44 Beachland Ave
- 119 Melba St
- 159 Wilcox Rd
- 44 Chester St
- 5 Vine St
- 62 Long Island View Rd
- 97 Carriage Path S Unit 97
- 10 Point Beach Dr
- 16 Point Beach Dr
- 32 Morehouse Ave
- 13 Richard St
- 38 Elaine Rd
- 236 Rogers Ave
- 404 Buckingham Ave