Estimated Value: $191,000 - $261,914
6
Beds
3
Baths
2,240
Sq Ft
$105/Sq Ft
Est. Value
About This Home
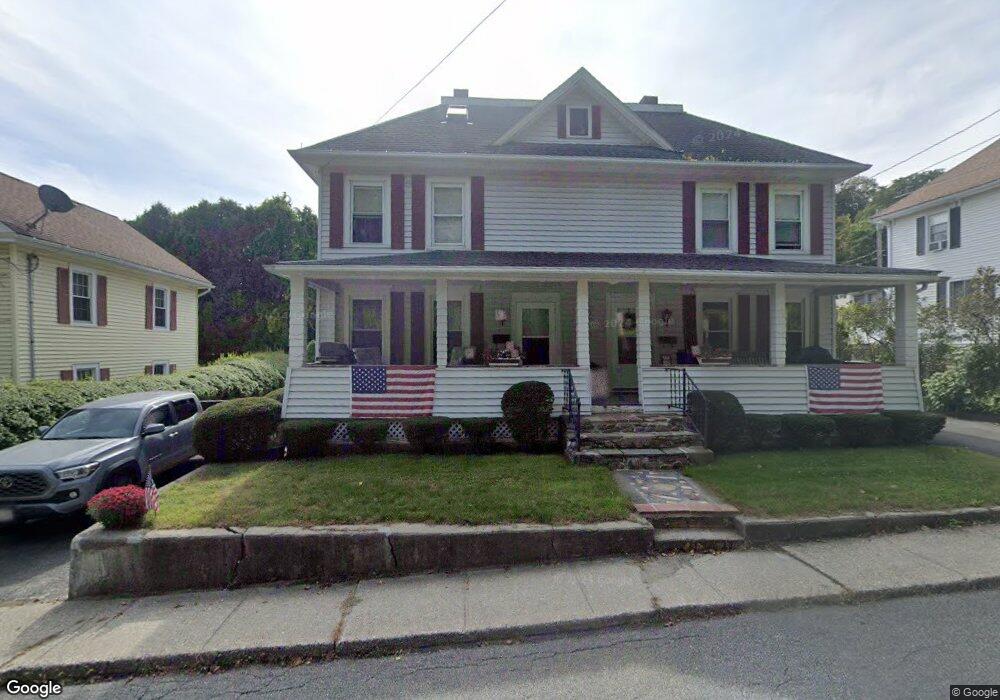
This home is located at 30 Fisk St Unit 32, Adams, MA 01220 and is currently estimated at $234,479, approximately $104 per square foot. 30 Fisk St Unit 32 is a home located in Berkshire County with nearby schools including Hoosac Valley Middle & High School, Berkshire Arts & Technology Charter Public School, and St. Stanislaus Kostka School.
Ownership History
Date
Name
Owned For
Owner Type
Purchase Details
Closed on
Jun 18, 2004
Sold by
Doktor Michelle J and Doktor Theodore
Bought by
Meczywor Stephen T
Current Estimated Value
Home Financials for this Owner
Home Financials are based on the most recent Mortgage that was taken out on this home.
Original Mortgage
$102,600
Outstanding Balance
$50,558
Interest Rate
6.12%
Mortgage Type
Purchase Money Mortgage
Estimated Equity
$183,921
Purchase Details
Closed on
Mar 3, 1999
Sold by
Sticka Shirley A
Bought by
Doktor Theodore
Create a Home Valuation Report for This Property
The Home Valuation Report is an in-depth analysis detailing your home's value as well as a comparison with similar homes in the area
Home Values in the Area
Average Home Value in this Area
Purchase History
| Date | Buyer | Sale Price | Title Company |
|---|---|---|---|
| Meczywor Stephen T | $108,000 | -- | |
| Doktor Theodore | $40,000 | -- |
Source: Public Records
Mortgage History
| Date | Status | Borrower | Loan Amount |
|---|---|---|---|
| Open | Doktor Theodore | $102,600 |
Source: Public Records
Tax History Compared to Growth
Tax History
| Year | Tax Paid | Tax Assessment Tax Assessment Total Assessment is a certain percentage of the fair market value that is determined by local assessors to be the total taxable value of land and additions on the property. | Land | Improvement |
|---|---|---|---|---|
| 2025 | $3,342 | $196,500 | $44,600 | $151,900 |
| 2024 | $3,157 | $180,000 | $41,800 | $138,200 |
| 2023 | $2,966 | $159,900 | $38,500 | $121,400 |
| 2022 | $2,914 | $139,500 | $33,400 | $106,100 |
| 2021 | $3,056 | $135,100 | $33,400 | $101,700 |
| 2020 | $2,895 | $132,300 | $33,500 | $98,800 |
| 2019 | $2,830 | $132,300 | $33,500 | $98,800 |
| 2018 | $2,898 | $130,500 | $33,500 | $97,000 |
| 2017 | $2,789 | $130,500 | $33,500 | $97,000 |
| 2016 | $2,550 | $119,200 | $33,500 | $85,700 |
| 2015 | $2,496 | $116,800 | $35,200 | $81,600 |
| 2014 | $2,330 | $116,800 | $35,200 | $81,600 |
Source: Public Records
Map
Nearby Homes
- 10 Enterprise St
- 50 Commercial St
- 4 Edmunds St Unit A101
- 29 Crandall St
- 219 West Rd
- 34-36 Crandall St
- 6 Crandall St
- 9 Pinnacle Point
- 2 Melrose St
- 3 Melrose St
- 71 Park St Unit 75
- 30 Summer St
- 17 Morningside Ave
- 52 Alger St
- 21 Overlook Terrace
- 9 Beecher St
- 2 Valley St
- 5 Richmond St
- 27 2nd St
- 16-18 E Hoosac St