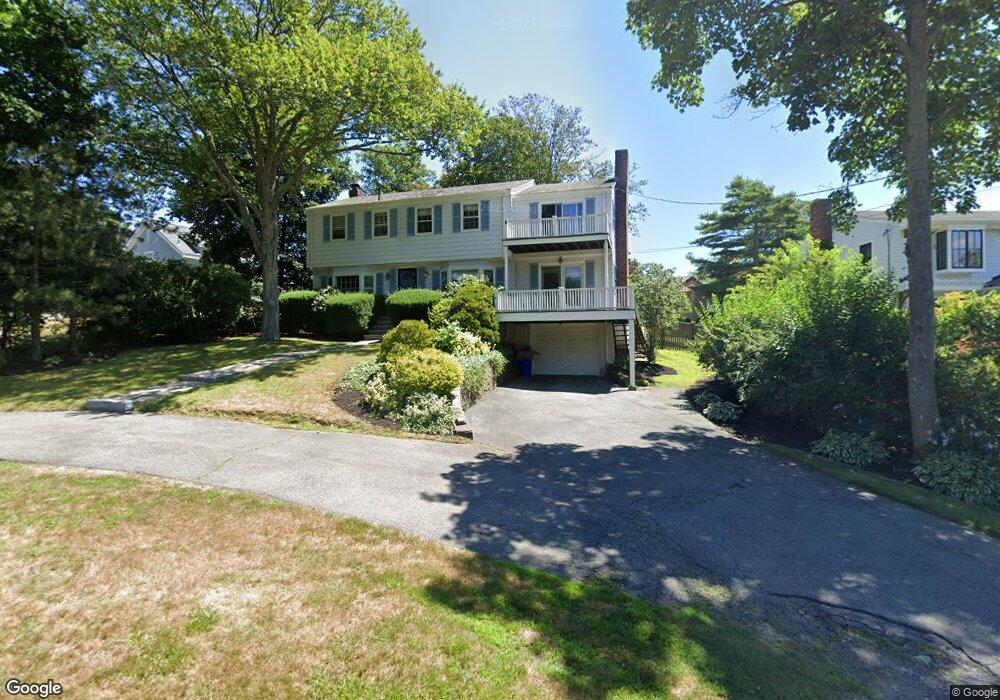
30 Flint St Marblehead, MA 01945
Estimated Value: $1,742,000 - $2,428,000
4
Beds
4
Baths
2,282
Sq Ft
$854/Sq Ft
Est. Value
About This Home
This home is located at 30 Flint St, Marblehead, MA 01945 and is currently estimated at $1,948,454, approximately $853 per square foot. 30 Flint St is a home located in Essex County with nearby schools including Marblehead High School, Marblehead Community Charter Public School, and Devereux School.
Ownership History
Date
Name
Owned For
Owner Type
Purchase Details
Closed on
Jun 11, 2003
Sold by
Robert J Vanwittenberg J and Robert Vanwittenberghe
Bought by
Vanwittenberghe Robert J
Current Estimated Value
Purchase Details
Closed on
Nov 27, 1995
Sold by
Mulvena Daniel and Mulvena Darlene
Bought by
R Vanwittenberghe Rt and Vanwittenberghe Robt
Create a Home Valuation Report for This Property
The Home Valuation Report is an in-depth analysis detailing your home's value as well as a comparison with similar homes in the area
Home Values in the Area
Average Home Value in this Area
Purchase History
| Date | Buyer | Sale Price | Title Company |
|---|---|---|---|
| Vanwittenberghe Robert J | -- | -- | |
| Vanwittenberghe Robert J | -- | -- | |
| R Vanwittenberghe Rt | $525,000 | -- | |
| R Vanwittenberghe Rt | $525,000 | -- |
Source: Public Records
Mortgage History
| Date | Status | Borrower | Loan Amount |
|---|---|---|---|
| Open | R Vanwittenberghe Rt | $520,000 | |
| Closed | R Vanwittenberghe Rt | $150,000 |
Source: Public Records
Tax History
| Year | Tax Paid | Tax Assessment Tax Assessment Total Assessment is a certain percentage of the fair market value that is determined by local assessors to be the total taxable value of land and additions on the property. | Land | Improvement |
|---|---|---|---|---|
| 2025 | $14,276 | $1,577,500 | $1,126,300 | $451,200 |
| 2024 | $16,738 | $1,868,100 | $1,431,000 | $437,100 |
| 2023 | $13,722 | $1,372,200 | $1,020,300 | $351,900 |
| 2022 | $13,663 | $1,298,800 | $954,000 | $344,800 |
| 2021 | $13,208 | $1,267,600 | $927,500 | $340,100 |
| 2020 | $13,669 | $1,315,600 | $993,800 | $321,800 |
| 2019 | $12,580 | $1,171,300 | $861,300 | $310,000 |
| 2018 | $11,885 | $1,078,500 | $768,500 | $310,000 |
| 2017 | $11,583 | $1,052,000 | $742,000 | $310,000 |
| 2016 | $11,089 | $999,000 | $689,000 | $310,000 |
| 2015 | $11,127 | $1,004,200 | $689,000 | $315,200 |
| 2014 | $10,656 | $960,900 | $662,500 | $298,400 |
Source: Public Records
Map
Nearby Homes
- 4 Ballast Ln
- 349 Ocean Ave
- 55 Brackett Place Unit B
- 23 Wyman Rd
- 7 Lee St Unit 3
- 9 Darling St
- 102 Front St Unit 1
- 290 Washington St Unit 1
- 290 Washington St Unit A
- 66 Pleasant St Unit 1
- 66 Pleasant St Unit 2
- 45 Pleasant St
- 4 Gallison Ave
- 7 Mechanic Ct
- 20 Mechanic Square Unit 3
- 20 Mechanic Square Unit 2
- 132 Elm St
- 132 Elm St Unit 132
- 27 Village St Unit 1
- 3 Frost Ln Unit 1