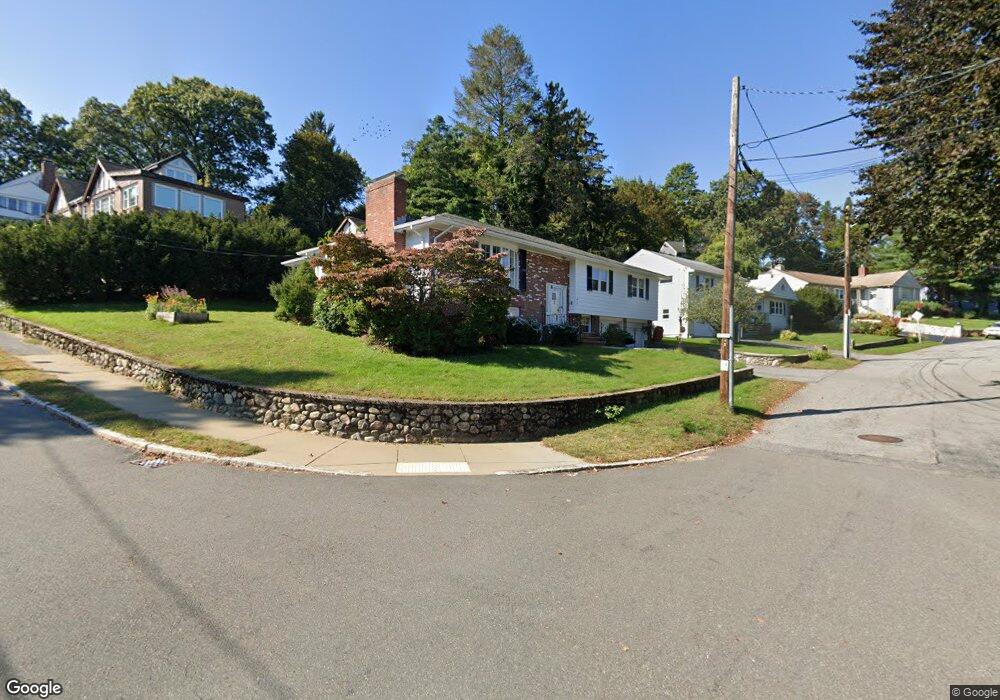
30 Frost St Unit 1 Arlington, MA 02474
Arlington Heights NeighborhoodEstimated Value: $1,308,777 - $1,446,000
3
Beds
2
Baths
2,000
Sq Ft
$684/Sq Ft
Est. Value
About This Home
This home is located at 30 Frost St Unit 1, Arlington, MA 02474 and is currently estimated at $1,368,694, approximately $684 per square foot. 30 Frost St Unit 1 is a home located in Middlesex County with nearby schools including M. Norcross Stratton Elementary School, Ottoson Middle School, and Arlington High School.
Ownership History
Date
Name
Owned For
Owner Type
Purchase Details
Closed on
May 11, 2010
Sold by
Edith C Arnold Ret and Consaga
Bought by
30 Street Rt and Privitera
Current Estimated Value
Home Financials for this Owner
Home Financials are based on the most recent Mortgage that was taken out on this home.
Original Mortgage
$440,000
Outstanding Balance
$294,625
Interest Rate
5.03%
Mortgage Type
Purchase Money Mortgage
Estimated Equity
$1,074,069
Create a Home Valuation Report for This Property
The Home Valuation Report is an in-depth analysis detailing your home's value as well as a comparison with similar homes in the area
Home Values in the Area
Average Home Value in this Area
Purchase History
| Date | Buyer | Sale Price | Title Company |
|---|---|---|---|
| 30 Street Rt | $550,000 | -- |
Source: Public Records
Mortgage History
| Date | Status | Borrower | Loan Amount |
|---|---|---|---|
| Open | 30 Street Rt | $440,000 |
Source: Public Records
Tax History Compared to Growth
Tax History
| Year | Tax Paid | Tax Assessment Tax Assessment Total Assessment is a certain percentage of the fair market value that is determined by local assessors to be the total taxable value of land and additions on the property. | Land | Improvement |
|---|---|---|---|---|
| 2025 | $12,305 | $1,142,500 | $578,700 | $563,800 |
| 2024 | $11,809 | $1,115,100 | $578,700 | $536,400 |
| 2023 | $10,540 | $940,200 | $497,900 | $442,300 |
| 2022 | $9,963 | $872,400 | $471,000 | $401,400 |
| 2021 | $9,893 | $872,400 | $471,000 | $401,400 |
| 2020 | $9,648 | $872,300 | $471,000 | $401,300 |
| 2019 | $8,935 | $793,500 | $471,000 | $322,500 |
| 2018 | $8,809 | $726,200 | $403,700 | $322,500 |
| 2017 | $8,783 | $699,300 | $376,800 | $322,500 |
| 2016 | $8,262 | $645,500 | $323,000 | $322,500 |
| 2015 | $7,921 | $584,600 | $289,300 | $295,300 |
Source: Public Records
Map
Nearby Homes
- 12 Longmeadow Rd
- 334 Mystic St
- 335 Mystic St
- 5A Wood Ln
- 5 Wood Ln
- 37 Pine St
- 6 Pawnee Dr
- 10 Apache Trail
- 52-56 Dudley St
- 10 Viking Rd
- 3 Victoria Rd Unit 3
- 3 Victoria Rd Unit 5
- 16 Ridge St
- 5 Norwich Cir
- 281 Forest St
- 18-20 Brattle St
- 975 Mass Ave Unit 106
- 975 Massachusetts Ave Unit 307
- 995 Massachusetts Ave Unit 404
- 1025 Massachusetts Ave Unit 204