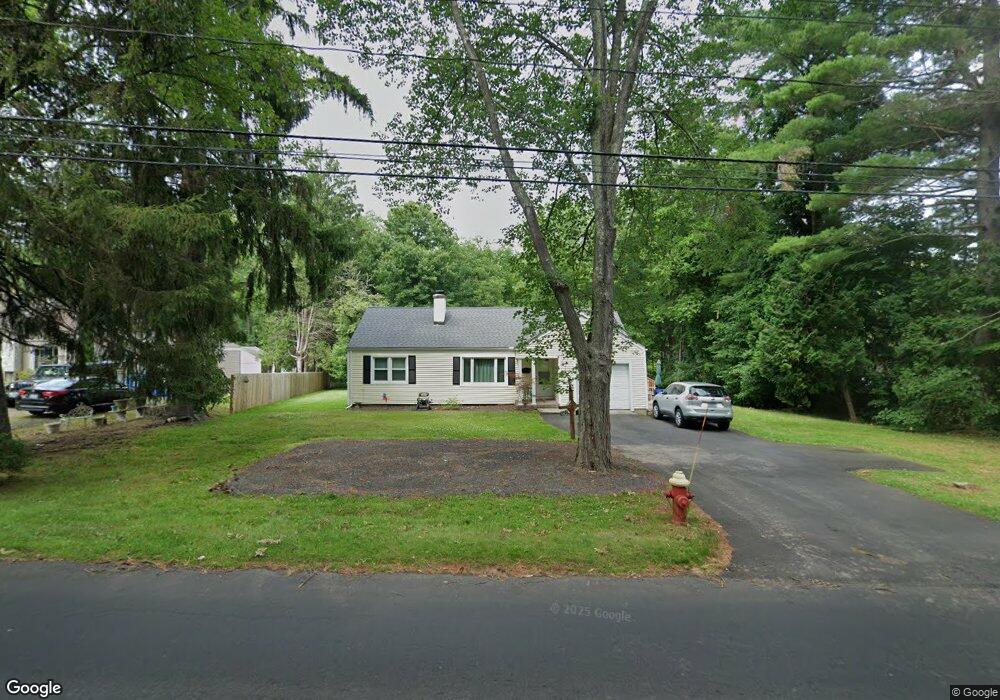
30 Gabb Rd Bloomfield, CT 06002
Estimated Value: $281,000 - $313,000
2
Beds
1
Bath
1,040
Sq Ft
$284/Sq Ft
Est. Value
About This Home
This home is located at 30 Gabb Rd, Bloomfield, CT 06002 and is currently estimated at $295,112, approximately $283 per square foot. 30 Gabb Rd is a home located in Hartford County with nearby schools including Laurel School, Carmen Arace Intermediate School, and Metacomet School.
Ownership History
Date
Name
Owned For
Owner Type
Purchase Details
Closed on
Jun 25, 2021
Sold by
Ann D Leavitt Lt and Leavitt
Bought by
Varley John M and Varley Tracy L
Current Estimated Value
Home Financials for this Owner
Home Financials are based on the most recent Mortgage that was taken out on this home.
Original Mortgage
$152,000
Outstanding Balance
$137,916
Interest Rate
2.9%
Mortgage Type
Purchase Money Mortgage
Estimated Equity
$157,196
Purchase Details
Closed on
Mar 24, 2005
Sold by
Andresen Christian
Bought by
Leavitt Ann
Purchase Details
Closed on
May 23, 1997
Sold by
Tinto John and Tinto Elinor
Bought by
Andresen Christian
Create a Home Valuation Report for This Property
The Home Valuation Report is an in-depth analysis detailing your home's value as well as a comparison with similar homes in the area
Home Values in the Area
Average Home Value in this Area
Purchase History
| Date | Buyer | Sale Price | Title Company |
|---|---|---|---|
| Varley John M | $160,000 | None Available | |
| Varley John M | $160,000 | None Available | |
| Leavitt Ann | $137,000 | -- | |
| Leavitt Ann | $137,000 | -- | |
| Andresen Christian | $85,000 | -- | |
| Andresen Christian | $85,000 | -- |
Source: Public Records
Mortgage History
| Date | Status | Borrower | Loan Amount |
|---|---|---|---|
| Open | Varley John M | $152,000 | |
| Closed | Varley John M | $152,000 | |
| Previous Owner | Andresen Christian | $30,000 | |
| Previous Owner | Andresen Christian | $105,000 | |
| Previous Owner | Andresen Christian | $25,000 |
Source: Public Records
Tax History
| Year | Tax Paid | Tax Assessment Tax Assessment Total Assessment is a certain percentage of the fair market value that is determined by local assessors to be the total taxable value of land and additions on the property. | Land | Improvement |
|---|---|---|---|---|
| 2025 | $7,017 | $187,110 | $57,260 | $129,850 |
| 2024 | $4,763 | $121,390 | $47,820 | $73,570 |
| 2023 | $4,677 | $121,390 | $47,820 | $73,570 |
| 2022 | $4,374 | $121,390 | $47,820 | $73,570 |
| 2021 | $4,471 | $121,390 | $47,820 | $73,570 |
| 2020 | $4,402 | $121,390 | $47,820 | $73,570 |
| 2019 | $4,693 | $121,390 | $47,820 | $73,570 |
| 2018 | $3,920 | $101,500 | $48,230 | $53,270 |
| 2017 | $3,914 | $101,500 | $48,230 | $53,270 |
| 2016 | $3,821 | $101,500 | $48,230 | $53,270 |
| 2015 | $3,750 | $101,500 | $48,230 | $53,270 |
| 2014 | $3,558 | $99,540 | $44,030 | $55,510 |
Source: Public Records
Map
Nearby Homes
- 79 Prospect St
- 81 Silo Way Unit 81
- 13 Hill Farm Rd
- 170 Thistle Pond Dr Unit 170
- 162 Thistle Pond Dr
- 26 Burnwood Dr
- 12 Filley St
- 49 Tyler St
- 99 Oliver Way Unit 99
- 256 Park Ave
- 17 Harwich Ln Unit 17
- 159 School St
- 31 Sutton Place
- 38 Sutton Place Unit 38
- 55 Timberwood Rd
- 25 Hilldale Rd
- 200 Castlewood Dr
- 36 Gale Rd
- 2 Camelot Dr Unit 4
- 5 Caramoor Park Unit 5
Your Personal Tour Guide
Ask me questions while you tour the home.