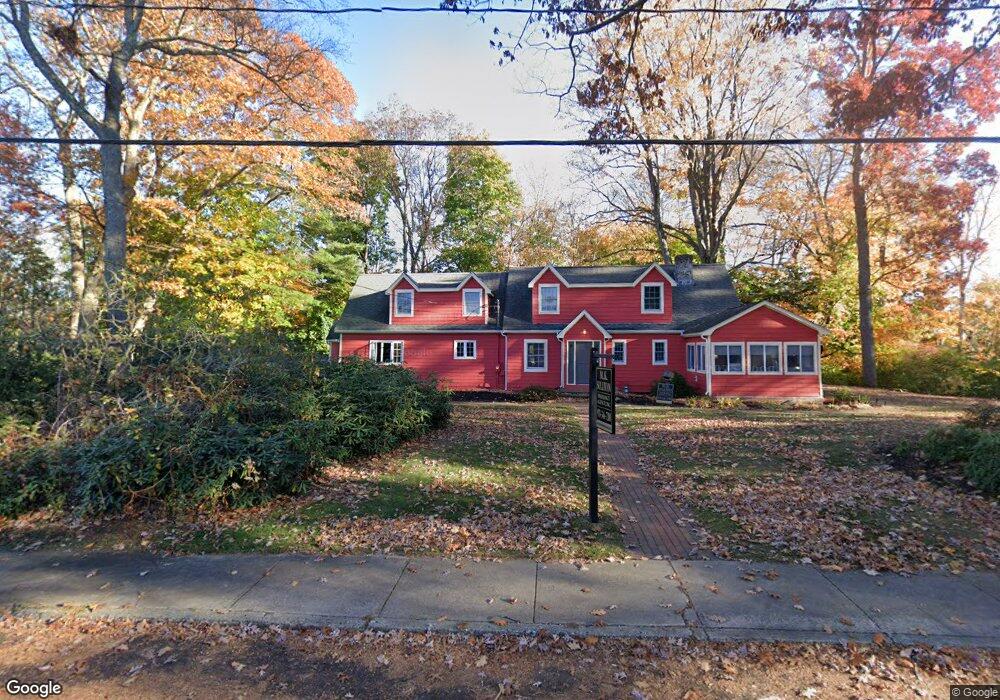
30 Grove St Merrimac, MA 01860
Estimated Value: $818,000 - $994,000
4
Beds
3
Baths
3,223
Sq Ft
$272/Sq Ft
Est. Value
About This Home
This home is located at 30 Grove St, Merrimac, MA 01860 and is currently estimated at $875,402, approximately $271 per square foot. 30 Grove St is a home located in Essex County with nearby schools including Pentucket Regional High School.
Ownership History
Date
Name
Owned For
Owner Type
Purchase Details
Closed on
Aug 5, 2024
Sold by
Sullivan Kevin J
Bought by
Kjs 2024 Ret and Sullivan
Current Estimated Value
Purchase Details
Closed on
Dec 6, 2017
Sold by
Sullivan Kevin J and Sullivan Mary E
Bought by
Sullivan Kevin J
Purchase Details
Closed on
Aug 1, 1996
Sold by
Dfs Rt and Swartz Dennis F
Bought by
Sullivan Kevin J and Sullivan Mary Ellen
Purchase Details
Closed on
Aug 23, 1989
Sold by
Jutras Joseph
Bought by
Harville Robert
Create a Home Valuation Report for This Property
The Home Valuation Report is an in-depth analysis detailing your home's value as well as a comparison with similar homes in the area
Home Values in the Area
Average Home Value in this Area
Purchase History
| Date | Buyer | Sale Price | Title Company |
|---|---|---|---|
| Kjs 2024 Ret | -- | None Available | |
| Kjs 2024 Ret | -- | None Available | |
| Sullivan Kevin J | -- | -- | |
| Sullivan Kevin J | $205,000 | -- | |
| Harville Robert | $117,000 | -- | |
| Sullivan Kevin J | -- | -- | |
| Sullivan Kevin J | $205,000 | -- | |
| Harville Robert | $117,000 | -- |
Source: Public Records
Mortgage History
| Date | Status | Borrower | Loan Amount |
|---|---|---|---|
| Previous Owner | Harville Robert | $169,000 | |
| Previous Owner | Harville Robert | $73,000 |
Source: Public Records
Tax History Compared to Growth
Tax History
| Year | Tax Paid | Tax Assessment Tax Assessment Total Assessment is a certain percentage of the fair market value that is determined by local assessors to be the total taxable value of land and additions on the property. | Land | Improvement |
|---|---|---|---|---|
| 2025 | $9,356 | $706,100 | $318,100 | $388,000 |
| 2024 | $9,118 | $675,400 | $300,400 | $375,000 |
| 2023 | $8,342 | $564,800 | $254,500 | $310,300 |
| 2022 | $7,962 | $487,300 | $205,000 | $282,300 |
| 2021 | $7,568 | $464,300 | $187,300 | $277,000 |
| 2020 | $6,909 | $464,300 | $187,300 | $277,000 |
| 2019 | $6,517 | $412,200 | $162,600 | $249,600 |
| 2018 | $6,414 | $407,000 | $152,000 | $255,000 |
| 2017 | $6,026 | $368,800 | $127,200 | $241,600 |
| 2016 | $5,743 | $355,400 | $127,200 | $228,200 |
| 2015 | $5,571 | $342,800 | $127,200 | $215,600 |
| 2014 | $5,447 | $342,800 | $127,200 | $215,600 |
Source: Public Records
Map
Nearby Homes