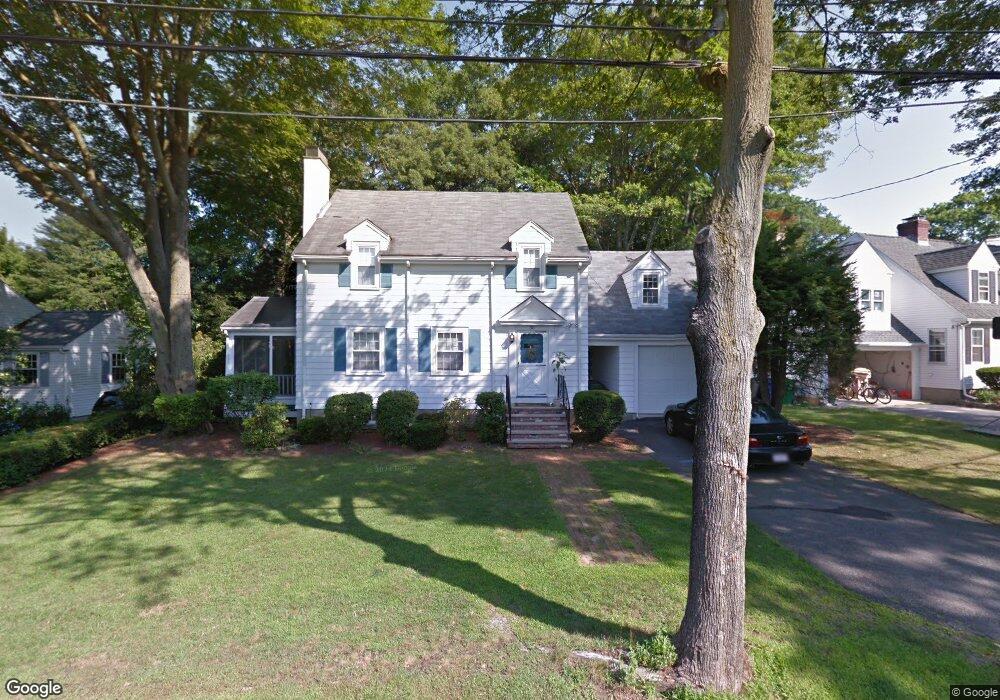
30 Hagen Rd Newton Center, MA 02459
Thompsonville NeighborhoodEstimated Value: $1,614,000 - $1,753,000
4
Beds
2
Baths
1,932
Sq Ft
$873/Sq Ft
Est. Value
About This Home
This home is located at 30 Hagen Rd, Newton Center, MA 02459 and is currently estimated at $1,686,228, approximately $872 per square foot. 30 Hagen Rd is a home located in Middlesex County with nearby schools including Bowen School, Countryside Elementary School, and Charles E Brown Middle School.
Ownership History
Date
Name
Owned For
Owner Type
Purchase Details
Closed on
Aug 3, 2006
Sold by
White Doris
Bought by
Philips Andrew L and Philips Heidi
Current Estimated Value
Home Financials for this Owner
Home Financials are based on the most recent Mortgage that was taken out on this home.
Original Mortgage
$502,000
Outstanding Balance
$300,409
Interest Rate
6.7%
Mortgage Type
Purchase Money Mortgage
Estimated Equity
$1,385,819
Create a Home Valuation Report for This Property
The Home Valuation Report is an in-depth analysis detailing your home's value as well as a comparison with similar homes in the area
Home Values in the Area
Average Home Value in this Area
Purchase History
| Date | Buyer | Sale Price | Title Company |
|---|---|---|---|
| Philips Andrew L | $627,500 | -- |
Source: Public Records
Mortgage History
| Date | Status | Borrower | Loan Amount |
|---|---|---|---|
| Open | Philips Andrew L | $502,000 |
Source: Public Records
Tax History Compared to Growth
Tax History
| Year | Tax Paid | Tax Assessment Tax Assessment Total Assessment is a certain percentage of the fair market value that is determined by local assessors to be the total taxable value of land and additions on the property. | Land | Improvement |
|---|---|---|---|---|
| 2025 | $12,956 | $1,322,000 | $909,200 | $412,800 |
| 2024 | $12,527 | $1,283,500 | $882,700 | $400,800 |
| 2023 | $11,975 | $1,176,300 | $673,600 | $502,700 |
| 2022 | $11,458 | $1,089,200 | $623,700 | $465,500 |
| 2021 | $11,056 | $1,027,500 | $588,400 | $439,100 |
| 2020 | $8,906 | $853,100 | $588,400 | $264,700 |
| 2019 | $8,656 | $828,300 | $571,300 | $257,000 |
| 2018 | $8,319 | $768,900 | $518,400 | $250,500 |
| 2017 | $7,820 | $703,200 | $489,100 | $214,100 |
| 2016 | $7,479 | $657,200 | $457,100 | $200,100 |
| 2015 | $7,131 | $614,200 | $427,200 | $187,000 |
Source: Public Records
Map
Nearby Homes