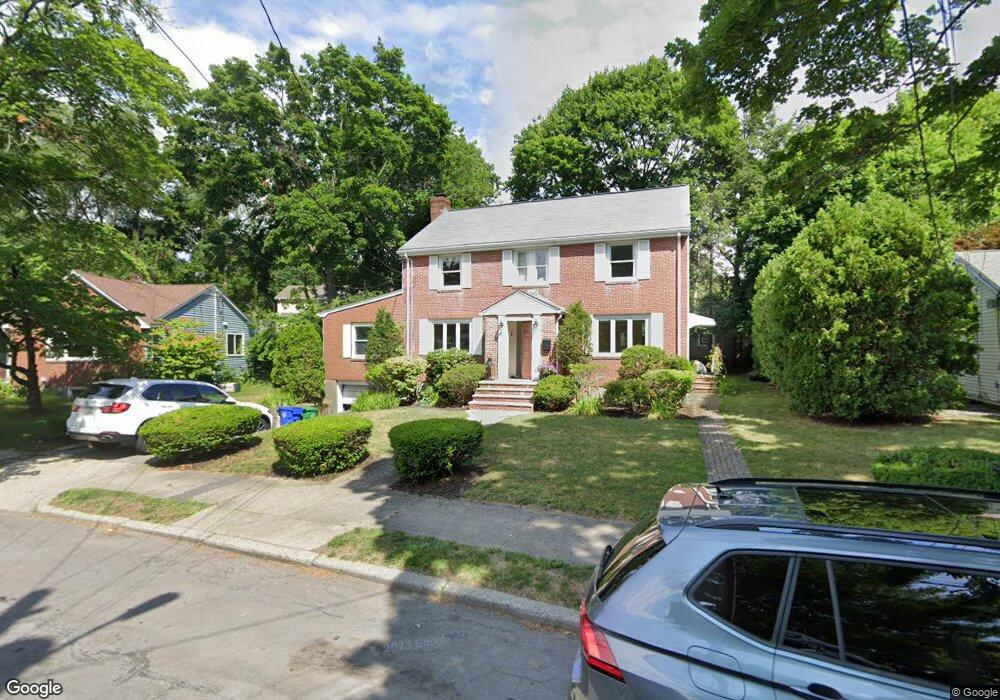
30 Haynes Rd Unit 30 Newton Center, MA 02459
Thompsonville NeighborhoodEstimated Value: $1,452,000 - $1,722,000
3
Beds
3
Baths
2,096
Sq Ft
$749/Sq Ft
Est. Value
About This Home
This home is located at 30 Haynes Rd Unit 30, Newton Center, MA 02459 and is currently estimated at $1,570,551, approximately $749 per square foot. 30 Haynes Rd Unit 30 is a home located in Middlesex County with nearby schools including Bowen School, Countryside Elementary School, and Charles E Brown Middle School.
Ownership History
Date
Name
Owned For
Owner Type
Purchase Details
Closed on
Dec 31, 1993
Sold by
Rosenthal David S
Bought by
Egener Todd and Egener Jennifer H
Current Estimated Value
Home Financials for this Owner
Home Financials are based on the most recent Mortgage that was taken out on this home.
Original Mortgage
$260,000
Interest Rate
7%
Mortgage Type
Purchase Money Mortgage
Create a Home Valuation Report for This Property
The Home Valuation Report is an in-depth analysis detailing your home's value as well as a comparison with similar homes in the area
Home Values in the Area
Average Home Value in this Area
Purchase History
| Date | Buyer | Sale Price | Title Company |
|---|---|---|---|
| Egener Todd | $325,000 | -- |
Source: Public Records
Mortgage History
| Date | Status | Borrower | Loan Amount |
|---|---|---|---|
| Open | Egener Todd | $230,000 | |
| Closed | Egener Todd | $235,000 | |
| Closed | Egener Todd | $260,000 |
Source: Public Records
Tax History Compared to Growth
Tax History
| Year | Tax Paid | Tax Assessment Tax Assessment Total Assessment is a certain percentage of the fair market value that is determined by local assessors to be the total taxable value of land and additions on the property. | Land | Improvement |
|---|---|---|---|---|
| 2025 | $11,810 | $1,205,100 | $953,800 | $251,300 |
| 2024 | $11,419 | $1,170,000 | $926,000 | $244,000 |
| 2023 | $10,873 | $1,068,100 | $711,700 | $356,400 |
| 2022 | $10,404 | $989,000 | $659,000 | $330,000 |
| 2021 | $10,039 | $933,000 | $621,700 | $311,300 |
| 2020 | $9,741 | $933,000 | $621,700 | $311,300 |
| 2019 | $9,466 | $905,800 | $603,600 | $302,200 |
| 2018 | $9,099 | $840,900 | $547,800 | $293,100 |
| 2017 | $8,821 | $793,300 | $516,800 | $276,500 |
| 2016 | $8,437 | $741,400 | $483,000 | $258,400 |
| 2015 | $8,045 | $692,900 | $451,400 | $241,500 |
Source: Public Records
Map
Nearby Homes