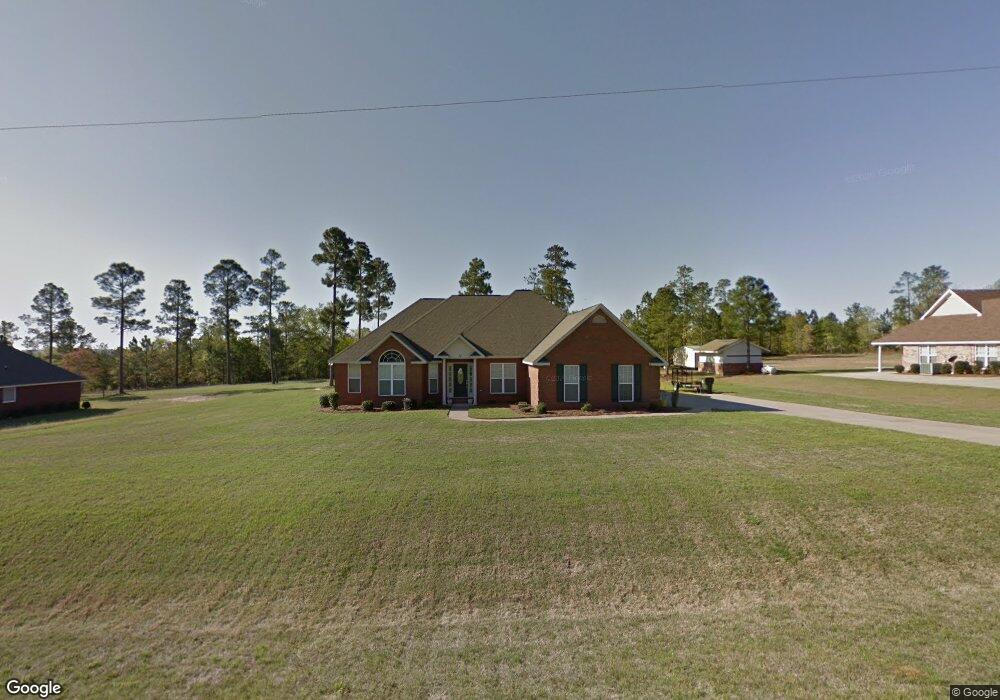
30 Hidden Canyon Ct Buena Vista, GA 31803
Estimated Value: $231,304 - $289,000
--
Bed
2
Baths
1,974
Sq Ft
$136/Sq Ft
Est. Value
About This Home
This home is located at 30 Hidden Canyon Ct, Buena Vista, GA 31803 and is currently estimated at $267,826, approximately $135 per square foot. 30 Hidden Canyon Ct is a home located in Marion County with nearby schools including L.K. Moss Elementary School and Marion County Middle/High School.
Ownership History
Date
Name
Owned For
Owner Type
Purchase Details
Closed on
Sep 18, 2015
Sold by
Idrell Terry
Bought by
Walton Harrell C
Current Estimated Value
Home Financials for this Owner
Home Financials are based on the most recent Mortgage that was taken out on this home.
Original Mortgage
$175,000
Outstanding Balance
$137,732
Interest Rate
3.97%
Mortgage Type
VA
Estimated Equity
$130,094
Purchase Details
Closed on
Apr 25, 2008
Sold by
Moon Fam Properties Inc
Bought by
Idrell Terry
Home Financials for this Owner
Home Financials are based on the most recent Mortgage that was taken out on this home.
Original Mortgage
$196,910
Interest Rate
5.82%
Mortgage Type
FHA
Purchase Details
Closed on
Oct 27, 2006
Sold by
Giles Building Co Llc
Bought by
Moon Fam Properties Inc
Purchase Details
Closed on
Oct 16, 1995
Bought by
Mike L Moon Enterpri
Create a Home Valuation Report for This Property
The Home Valuation Report is an in-depth analysis detailing your home's value as well as a comparison with similar homes in the area
Home Values in the Area
Average Home Value in this Area
Purchase History
| Date | Buyer | Sale Price | Title Company |
|---|---|---|---|
| Walton Harrell C | $175,000 | -- | |
| Idrell Terry | $200,000 | -- | |
| Moon Fam Properties Inc | $35,000 | -- | |
| Mike L Moon Enterpri | -- | -- |
Source: Public Records
Mortgage History
| Date | Status | Borrower | Loan Amount |
|---|---|---|---|
| Open | Walton Harrell C | $175,000 | |
| Previous Owner | Idrell Terry | $196,910 |
Source: Public Records
Tax History Compared to Growth
Tax History
| Year | Tax Paid | Tax Assessment Tax Assessment Total Assessment is a certain percentage of the fair market value that is determined by local assessors to be the total taxable value of land and additions on the property. | Land | Improvement |
|---|---|---|---|---|
| 2024 | -- | $73,440 | $6,000 | $67,440 |
| 2023 | $1,742 | $73,440 | $6,000 | $67,440 |
| 2022 | $1,672 | $70,486 | $6,000 | $64,486 |
| 2021 | $1,679 | $70,486 | $6,000 | $64,486 |
| 2020 | $1,679 | $70,486 | $6,000 | $64,486 |
| 2019 | $1,679 | $70,486 | $6,000 | $64,486 |
| 2018 | $1,679 | $70,486 | $6,000 | $64,486 |
| 2017 | $1,679 | $70,486 | $6,000 | $64,486 |
| 2016 | -- | $70,486 | $6,000 | $64,486 |
| 2015 | -- | $70,486 | $6,000 | $64,486 |
| 2014 | -- | $70,486 | $6,000 | $64,486 |
| 2013 | -- | $70,486 | $6,000 | $64,486 |
Source: Public Records
Map
Nearby Homes
- 37 Hidden Canyon Ct
- Berginville Rd
- LOT B Pineville Rd Unit 100+/- ACRES
- 0 Pineville Rd Unit 121+/- ACRES
- LOT A Pineville Rd Unit 100+/- ACRES
- 0 Pineville Rd
- 1 Pineville Rd
- 4543 S Highway 41 Rd
- 114 Mccarthy Rd
- 0 Burginville R Burginville Rd
- 4130 Georgia 26
- 0 Georgia 26 Unit 193035
- 297 Ga Highway 240
- 58 Daisy Ln
- 134 E 4th Ave
- 130 W 2nd Ave
- 233 5th Ave
- 402 E 6th Ave
- 114 Mccarthy Dr
- 208 Georgia 137
- 56 Hidden Canyon Ct
- 26 Hidden Canyon Ct
- 1607 Pineville Rd
- 68 Hidden Canyon Ct
- 1583 Pineville Rd
- 1545 Pineville Rd
- 1707 Pineville Rd
- 1521 Pineville Rd
- 1479 Pineville Rd
- 1453 Pineville Rd
- 1437 Pineville Rd
- 1397 Pineville Rd
- 1383 Pineville Rd
- 1353 Pineville Rd
- 1307 Pineville Rd
- 2021 Pineville Rd
- 0 Tower Point Rd Unit 21327238
- 0 Tower Point Rd Unit 20241896
- 0 Tower Point Rd Unit 20143480
- 0 Tower Point Rd Unit 20035294