Estimated Value: $391,974 - $455,000
--
Bed
2
Baths
2,522
Sq Ft
$171/Sq Ft
Est. Value
About This Home
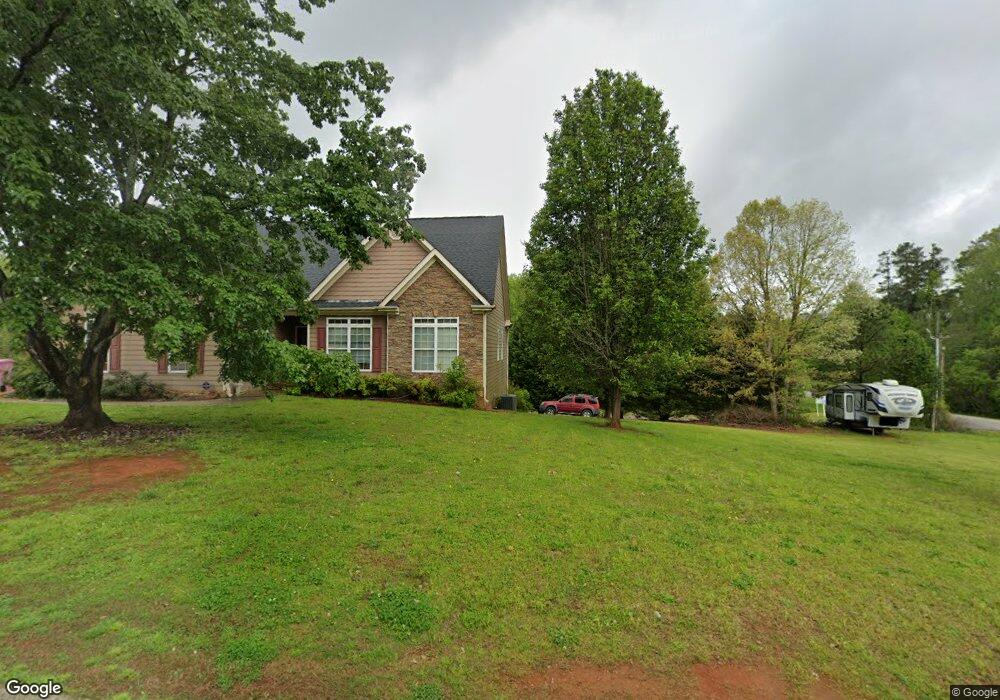
This home is located at 30 Hidden Falls Dr, Hull, GA 30646 and is currently estimated at $430,244, approximately $170 per square foot. 30 Hidden Falls Dr is a home located in Madison County with nearby schools including Madison County High School.
Ownership History
Date
Name
Owned For
Owner Type
Purchase Details
Closed on
Feb 16, 2018
Sold by
Sartain Paul Britton
Bought by
Sartain Paul Britton and Sartain Cynthia C
Current Estimated Value
Home Financials for this Owner
Home Financials are based on the most recent Mortgage that was taken out on this home.
Original Mortgage
$180,000
Outstanding Balance
$152,635
Interest Rate
4.04%
Mortgage Type
New Conventional
Estimated Equity
$277,609
Purchase Details
Closed on
Nov 29, 2017
Sold by
Raemy Ollie M
Bought by
Sartain Britt
Purchase Details
Closed on
Jan 30, 2009
Sold by
Sartain Britt
Bought by
Raemy Ollie
Purchase Details
Closed on
Sep 9, 2003
Sold by
Walker Ed
Bought by
Biltmore Development Llc
Purchase Details
Closed on
Jul 28, 1998
Sold by
Kilgore Janis Crocke
Bought by
Walker Ed
Purchase Details
Closed on
Jan 1, 1994
Bought by
Kilgore Janis Crocke
Create a Home Valuation Report for This Property
The Home Valuation Report is an in-depth analysis detailing your home's value as well as a comparison with similar homes in the area
Home Values in the Area
Average Home Value in this Area
Purchase History
| Date | Buyer | Sale Price | Title Company |
|---|---|---|---|
| Sartain Paul Britton | -- | -- | |
| Sartain Britt | -- | -- | |
| Raemy Ollie | -- | -- | |
| Biltmore Development Llc | -- | -- | |
| Walker Ed | $128,000 | -- | |
| Kilgore Janis Crocke | -- | -- |
Source: Public Records
Mortgage History
| Date | Status | Borrower | Loan Amount |
|---|---|---|---|
| Open | Sartain Paul Britton | $180,000 |
Source: Public Records
Tax History Compared to Growth
Tax History
| Year | Tax Paid | Tax Assessment Tax Assessment Total Assessment is a certain percentage of the fair market value that is determined by local assessors to be the total taxable value of land and additions on the property. | Land | Improvement |
|---|---|---|---|---|
| 2024 | $3,991 | $146,858 | $12,000 | $134,858 |
| 2023 | $4,453 | $138,691 | $12,000 | $126,691 |
| 2022 | $3,473 | $124,083 | $12,000 | $112,083 |
| 2021 | $3,171 | $98,768 | $12,000 | $86,768 |
| 2020 | $3,186 | $98,768 | $12,000 | $86,768 |
| 2019 | $3,169 | $97,102 | $12,000 | $85,102 |
| 2018 | $3,102 | $94,732 | $12,000 | $82,732 |
| 2017 | $2,875 | $95,938 | $12,000 | $83,938 |
| 2016 | $2,032 | $77,445 | $12,000 | $65,445 |
| 2015 | $2,021 | $77,445 | $12,000 | $65,445 |
| 2014 | $1,712 | $67,117 | $12,000 | $55,117 |
| 2013 | -- | $67,117 | $12,000 | $55,117 |
Source: Public Records
Map
Nearby Homes
- 0 Virginia Ln Unit Lot 15 CL336098
- 0 Virginia Ln Unit LOT 15 10579204
- 838 Virginia Ln
- 0 Spratlin Mill Rd Unit 1025918
- 0 Spratlin Mill Rd Unit 10526335
- 0 Woodland Creek Place Unit 10421130
- 1309 Hull Rd
- 525 Virginia Ln
- 151 Rolling Woods Ln
- 181 Bedford Dr
- 300 Harve Mathis Rd
- 685 Bedford Dr
- 540 & 542 Harve Mathis Rd
- 481 Bedford Dr
- 136 Wellington Dr
- 0 Spratlin Mill Dr Unit 7665837
- 0 Spratlin Mill Dr Unit LOT 14-C
- 1329 Spratlin Mill Dr
- 336 Old Pittard Rd
- 0 Glen Carrie Rd Unit 7268684
- 35 Hidden Falls Dr
- 361 Glenn Carrie Rd
- 50 Hidden Falls Dr
- 0 Hidden Falls Dr Unit LOT 9 2900679
- 0 Hidden Falls Dr Unit LOT 9 7047100
- 0 Hidden Falls Dr Unit LOT 9 7199049
- 0 Hidden Falls Dr Unit 9 8032084
- 000 Hidden Falls Dr
- 0 Hidden Falls Dr
- 0 Hidden Falls Dr Unit CM935439
- 0 Hidden Falls Dr Unit 9034960
- 0 Hidden Falls Dr Unit 7005332
- 0 Hidden Falls Dr Unit 7097161
- 0 Hidden Falls Dr Unit 7507254
- 0 Hidden Falls Dr Unit 8027232
- 55 Hidden Falls Dr
- 332 Glenn Carrie Rd
- 84 Hidden Falls Dr
- 288 Glenn Carrie Rd