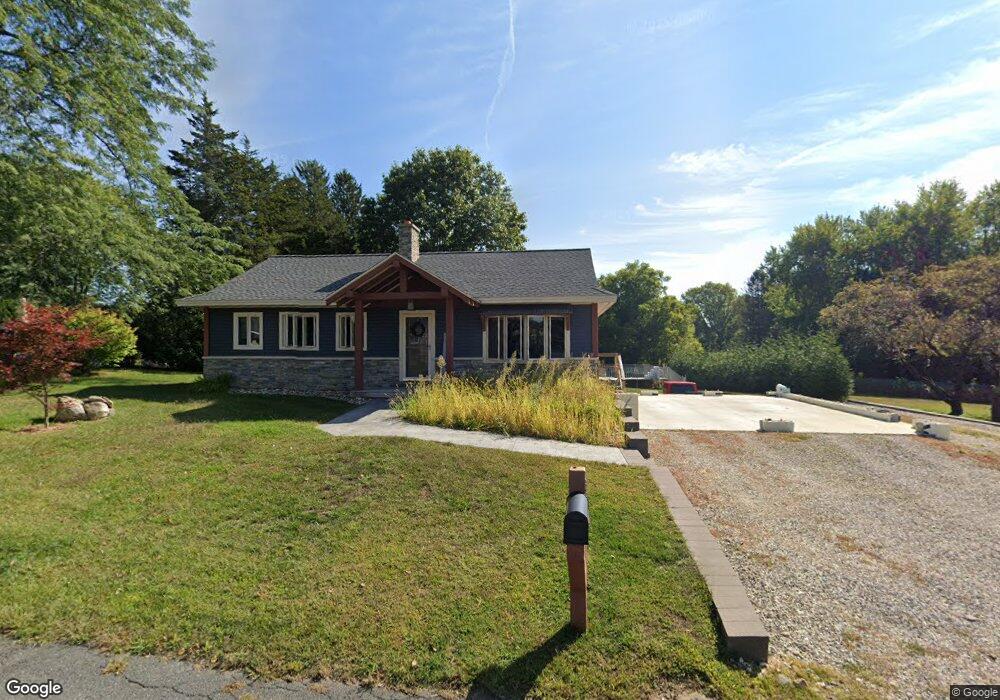
30 High St Granby, MA 01033
Estimated Value: $304,000 - $397,000
3
Beds
1
Bath
960
Sq Ft
$351/Sq Ft
Est. Value
About This Home
This home is located at 30 High St, Granby, MA 01033 and is currently estimated at $337,264, approximately $351 per square foot. 30 High St is a home located in Hampshire County with nearby schools including East Meadow School, Granby Junior/Senior High School, and Pioneer Valley Performing Arts Charter School.
Ownership History
Date
Name
Owned For
Owner Type
Purchase Details
Closed on
Oct 28, 2004
Sold by
Isabelle Dorothy L and Sabourin Dorothy L
Bought by
Gagnon Chad and Gagnon Heather L
Current Estimated Value
Home Financials for this Owner
Home Financials are based on the most recent Mortgage that was taken out on this home.
Original Mortgage
$137,750
Interest Rate
5.74%
Mortgage Type
Purchase Money Mortgage
Create a Home Valuation Report for This Property
The Home Valuation Report is an in-depth analysis detailing your home's value as well as a comparison with similar homes in the area
Home Values in the Area
Average Home Value in this Area
Purchase History
| Date | Buyer | Sale Price | Title Company |
|---|---|---|---|
| Gagnon Chad | $145,000 | -- | |
| Gagnon Chad | $145,000 | -- |
Source: Public Records
Mortgage History
| Date | Status | Borrower | Loan Amount |
|---|---|---|---|
| Open | Gagnon Chad | $127,900 | |
| Closed | Gagnon Chad | $137,750 |
Source: Public Records
Tax History
| Year | Tax Paid | Tax Assessment Tax Assessment Total Assessment is a certain percentage of the fair market value that is determined by local assessors to be the total taxable value of land and additions on the property. | Land | Improvement |
|---|---|---|---|---|
| 2025 | $4,141 | $269,400 | $82,900 | $186,500 |
| 2024 | $4,154 | $271,000 | $78,900 | $192,100 |
| 2023 | $3,971 | $232,100 | $70,400 | $161,700 |
| 2022 | $3,865 | $202,800 | $70,400 | $132,400 |
| 2021 | $3,795 | $191,200 | $70,400 | $120,800 |
| 2020 | $3,598 | $182,000 | $68,400 | $113,600 |
| 2019 | $3,578 | $184,800 | $85,300 | $99,500 |
| 2018 | $3,508 | $176,000 | $85,300 | $90,700 |
| 2017 | $3,186 | $176,000 | $85,300 | $90,700 |
| 2016 | $3,032 | $160,700 | $78,900 | $81,800 |
| 2015 | $2,942 | $160,700 | $78,900 | $81,800 |
Source: Public Records
Map
Nearby Homes
- 289 Morgan St
- Lot A East St
- 5 Helm St
- 540 Granby Rd Unit 72A
- 540 Granby Rd Unit 77C
- 540 Granby Rd Unit 76B
- 540 Granby Rd Unit 131
- 105 Mountain View St
- 110 Mountain View St
- 41 Ashton Ln
- 140 Pine Grove Dr
- 124 Silver St
- 24 Sunset Ave
- 6 Jennifer Dr
- 96 College St
- 124 College St Unit 20
- 67 Boynton Ave
- 104 Pittroff Ave
- 11 Hadley St
- 53 West St
Your Personal Tour Guide
Ask me questions while you tour the home.