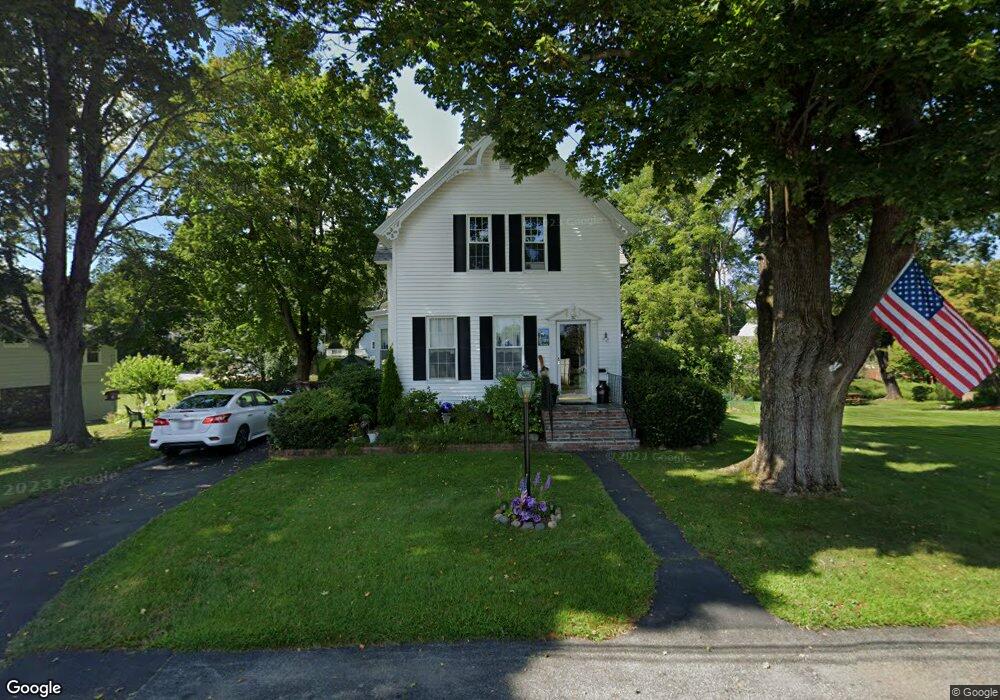
30 Highland St Southbridge, MA 01550
Estimated Value: $429,919 - $465,000
5
Beds
2
Baths
3,402
Sq Ft
$132/Sq Ft
Est. Value
About This Home
This home is located at 30 Highland St, Southbridge, MA 01550 and is currently estimated at $449,480, approximately $132 per square foot. 30 Highland St is a home located in Worcester County with nearby schools including Trinity Catholic Academy and ViewPoint Christian Academy.
Ownership History
Date
Name
Owned For
Owner Type
Purchase Details
Closed on
Jul 19, 2013
Sold by
Ferron Paul F and Ferron Carol A
Bought by
Ferron Ft
Current Estimated Value
Purchase Details
Closed on
Sep 9, 1976
Bought by
Ferron Ft
Create a Home Valuation Report for This Property
The Home Valuation Report is an in-depth analysis detailing your home's value as well as a comparison with similar homes in the area
Home Values in the Area
Average Home Value in this Area
Purchase History
| Date | Buyer | Sale Price | Title Company |
|---|---|---|---|
| Ferron Ft | -- | -- | |
| Ferron Ft | -- | -- | |
| Ferron Ft | $36,000 | -- |
Source: Public Records
Mortgage History
| Date | Status | Borrower | Loan Amount |
|---|---|---|---|
| Previous Owner | Ferron Ft | $24,500 | |
| Previous Owner | Ferron Ft | $30,000 |
Source: Public Records
Tax History Compared to Growth
Tax History
| Year | Tax Paid | Tax Assessment Tax Assessment Total Assessment is a certain percentage of the fair market value that is determined by local assessors to be the total taxable value of land and additions on the property. | Land | Improvement |
|---|---|---|---|---|
| 2025 | $6,241 | $425,700 | $39,700 | $386,000 |
| 2024 | $5,961 | $390,600 | $33,100 | $357,500 |
| 2023 | $5,573 | $351,800 | $33,100 | $318,700 |
| 2022 | $5,239 | $292,700 | $28,300 | $264,400 |
| 2021 | $4,584 | $235,800 | $28,300 | $207,500 |
| 2020 | $4,371 | $224,400 | $28,300 | $196,100 |
| 2018 | $4,109 | $198,000 | $28,300 | $169,700 |
| 2017 | $3,746 | $182,100 | $28,300 | $153,800 |
| 2016 | $3,680 | $182,100 | $28,300 | $153,800 |
| 2015 | $3,708 | $182,100 | $28,300 | $153,800 |
| 2014 | $3,576 | $182,100 | $28,300 | $153,800 |
Source: Public Records
Map
Nearby Homes