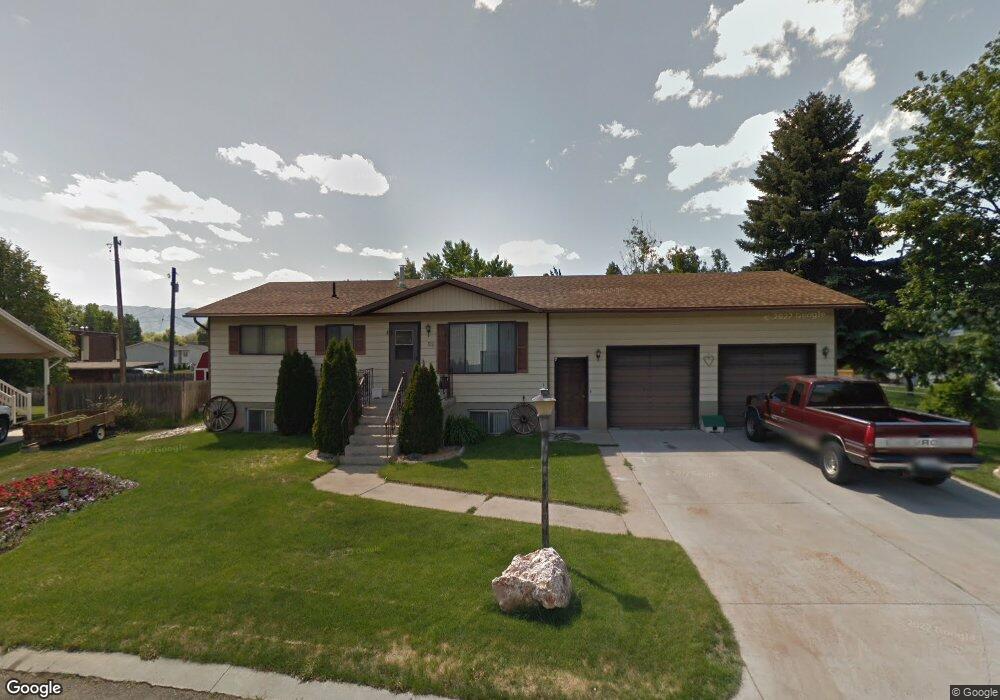
30 Hollyhock Ln Logan, UT 84321
Woodruff NeighborhoodEstimated Value: $397,000 - $436,324
5
Beds
3
Baths
2,328
Sq Ft
$180/Sq Ft
Est. Value
About This Home
This home is located at 30 Hollyhock Ln, Logan, UT 84321 and is currently estimated at $419,831, approximately $180 per square foot. 30 Hollyhock Ln is a home located in Cache County with nearby schools including Hillcrest Elementary School, Mount Logan Middle School, and Logan High School.
Ownership History
Date
Name
Owned For
Owner Type
Purchase Details
Closed on
Jun 1, 2021
Sold by
Messmer Terry A and Messmer Linda Hoffert
Bought by
Messmer Terry Allen and Messmer Linda Hoffert
Current Estimated Value
Purchase Details
Closed on
Dec 27, 2017
Sold by
Spillman Daniel Vicent and Olsen Ted Miller
Bought by
Hoffert Messmer Terry A and Hoffert Messmer Linda
Create a Home Valuation Report for This Property
The Home Valuation Report is an in-depth analysis detailing your home's value as well as a comparison with similar homes in the area
Home Values in the Area
Average Home Value in this Area
Purchase History
| Date | Buyer | Sale Price | Title Company |
|---|---|---|---|
| Messmer Terry Allen | -- | None Available | |
| Hoffert Messmer Terry A | -- | -- | |
| Spillman Daniel Vincent | -- | -- |
Source: Public Records
Tax History
| Year | Tax Paid | Tax Assessment Tax Assessment Total Assessment is a certain percentage of the fair market value that is determined by local assessors to be the total taxable value of land and additions on the property. | Land | Improvement |
|---|---|---|---|---|
| 2025 | $1,982 | $256,400 | $0 | $0 |
| 2023 | $1,829 | $218,425 | $0 | $0 |
| 2022 | $1,959 | $218,420 | $0 | $0 |
| 2021 | $1,910 | $309,420 | $58,500 | $250,920 |
| 2020 | $1,879 | $271,600 | $58,500 | $213,100 |
| 2019 | $1,952 | $269,990 | $58,500 | $211,490 |
| 2018 | $1,784 | $223,895 | $43,195 | $180,700 |
| 2017 | $1,207 | $86,455 | $0 | $0 |
| 2016 | $1,252 | $86,455 | $0 | $0 |
| 2015 | $1,253 | $86,455 | $0 | $0 |
| 2014 | $1,035 | $79,000 | $0 | $0 |
| 2013 | -- | $79,190 | $0 | $0 |
Source: Public Records
Map
Nearby Homes
Your Personal Tour Guide
Ask me questions while you tour the home.