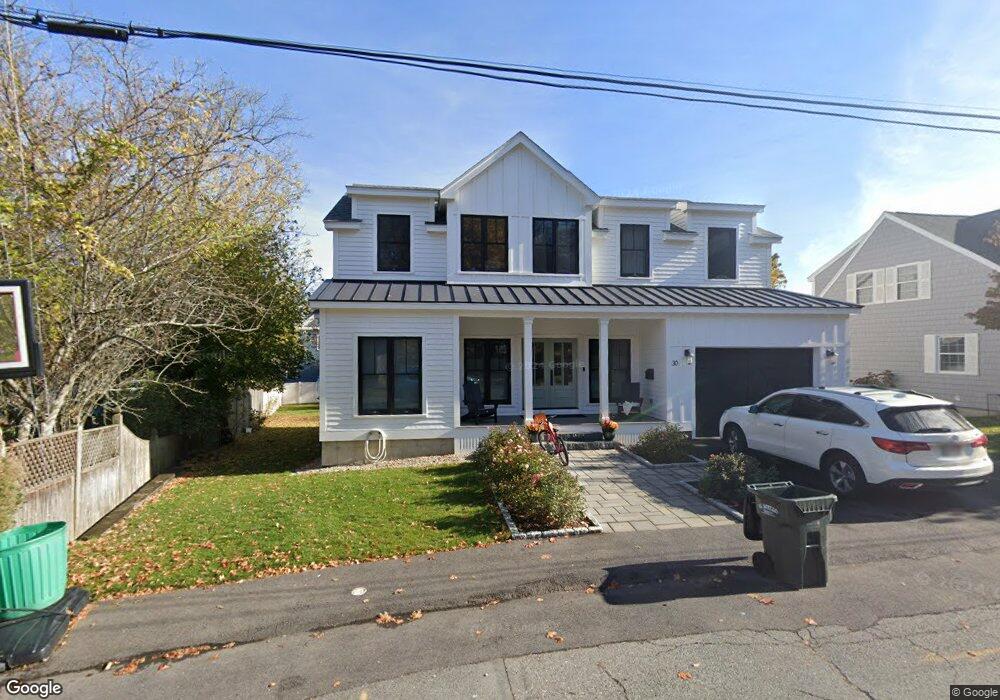
30 Howard St Newburyport, MA 01950
Estimated Value: $1,336,000 - $1,534,000
4
Beds
3
Baths
2,736
Sq Ft
$530/Sq Ft
Est. Value
About This Home
This home is located at 30 Howard St, Newburyport, MA 01950 and is currently estimated at $1,449,853, approximately $529 per square foot. 30 Howard St is a home located in Essex County with nearby schools including Francis T. Bresnahan Elementary School, Edward G. Molin Elementary School, and Rupert A. Nock Middle School.
Ownership History
Date
Name
Owned For
Owner Type
Purchase Details
Closed on
May 30, 2023
Sold by
Traister Denisa Q and Traister Michael B
Bought by
Smith Point Ret and Traister
Current Estimated Value
Purchase Details
Closed on
Feb 21, 2020
Sold by
Traister Kathleen A and Traister Michael B
Bought by
Traister Denisa Q and Traister Michael B
Home Financials for this Owner
Home Financials are based on the most recent Mortgage that was taken out on this home.
Original Mortgage
$320,000
Interest Rate
3.6%
Mortgage Type
New Conventional
Purchase Details
Closed on
Sep 4, 2019
Sold by
Bell Ft
Bought by
Traister Kathleen A and Traister Richard G
Purchase Details
Closed on
Mar 17, 2009
Sold by
Bell Frederic C
Bought by
Bell Jr Tr Frederick C
Purchase Details
Closed on
Mar 27, 2003
Sold by
Bell Dorothy L and Bell Frederic C
Bought by
Bell Frederic C
Create a Home Valuation Report for This Property
The Home Valuation Report is an in-depth analysis detailing your home's value as well as a comparison with similar homes in the area
Home Values in the Area
Average Home Value in this Area
Purchase History
| Date | Buyer | Sale Price | Title Company |
|---|---|---|---|
| Smith Point Ret | -- | None Available | |
| Smith Point Ret | -- | None Available | |
| Traister Denisa Q | $400,000 | None Available | |
| Traister Denisa Q | $400,000 | None Available | |
| Traister Kathleen A | $400,000 | -- | |
| Bell Jr Tr Frederick C | -- | -- | |
| Bell Jr Tr Frederick C | -- | -- | |
| Bell Frederic C | -- | -- | |
| Bell Frederic C | -- | -- |
Source: Public Records
Mortgage History
| Date | Status | Borrower | Loan Amount |
|---|---|---|---|
| Previous Owner | Traister Denisa Q | $320,000 |
Source: Public Records
Tax History Compared to Growth
Tax History
| Year | Tax Paid | Tax Assessment Tax Assessment Total Assessment is a certain percentage of the fair market value that is determined by local assessors to be the total taxable value of land and additions on the property. | Land | Improvement |
|---|---|---|---|---|
| 2025 | $11,143 | $1,163,200 | $398,000 | $765,200 |
| 2024 | $10,642 | $1,067,400 | $361,800 | $705,600 |
| 2023 | $10,173 | $947,200 | $314,500 | $632,700 |
| 2022 | $16,402 | $1,365,700 | $262,100 | $1,103,600 |
| 2021 | $4,791 | $379,000 | $238,300 | $140,700 |
| 2020 | $4,794 | $373,400 | $238,300 | $135,100 |
| 2019 | $4,749 | $363,100 | $238,300 | $124,800 |
| 2018 | $4,597 | $346,700 | $227,000 | $119,700 |
| 2017 | $4,449 | $330,800 | $216,200 | $114,600 |
| 2016 | $4,330 | $323,400 | $205,900 | $117,500 |
| 2015 | $4,159 | $311,800 | $205,900 | $105,900 |
Source: Public Records
Map
Nearby Homes
- 19 Jefferson St
- 287 1/2 High St
- 1 Jefferson St
- 288 Merrimac St
- 266 Merrimac St Unit F
- 13 Broad St
- 27 Warren St Unit 1
- 42 Myrtle Ave
- 6 Storey Ave
- 17 Alberta Ave
- 492 Merrimac St
- 138 Low St
- 158 Merrimac St Unit 3
- 126 Merrimac St Unit 47
- 126 Merrimac St Unit 35
- 110 Low St
- 510 Merrimac St Unit 512
- 45 Boardman St Unit 1
- 44 Washington St Unit C
- 41 Washington St Unit B
- 28 Howard St
- 5 Forrester St
- 7 Forrester St
- 325 Merrimac St
- 3 Forrester St
- 27 Howard St
- 29 Howard St
- 31 Howard St
- 26 Howard St
- 11 Forrester St
- 11 Forrester St Unit A
- 323 Merrimac St
- 321 Merrimac St
- 327 Merrimac St
- 327 Merrimac St Unit 1
- 327 Merrimac St Unit 327
- 319 Merrimac St
- 14 Forrester St
- 14 Forrester St Unit 14
- 13 Forrester St