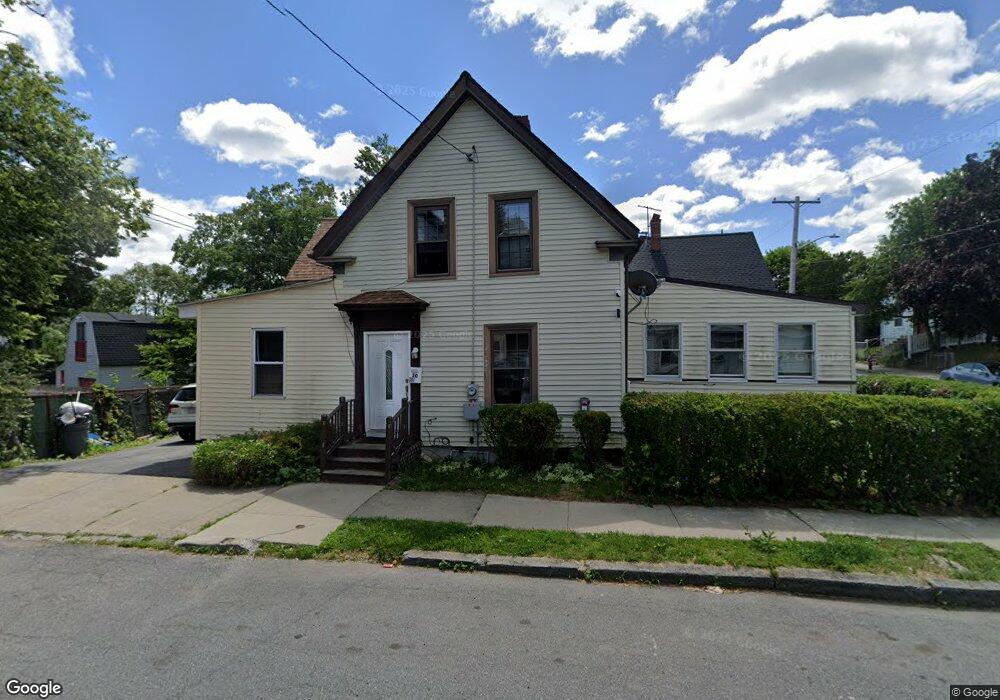
30 Ingalls St Lynn, MA 01902
Fayette Street NeighborhoodEstimated Value: $479,000 - $550,000
3
Beds
2
Baths
1,656
Sq Ft
$310/Sq Ft
Est. Value
About This Home
This home is located at 30 Ingalls St, Lynn, MA 01902 and is currently estimated at $513,558, approximately $310 per square foot. 30 Ingalls St is a home located in Essex County with nearby schools including Ingalls Elementary School, William R. Fallon School, and Marshall Middle School.
Ownership History
Date
Name
Owned For
Owner Type
Purchase Details
Closed on
May 6, 2005
Sold by
Torres David
Bought by
Odney Samuel and Odney Barbara
Current Estimated Value
Home Financials for this Owner
Home Financials are based on the most recent Mortgage that was taken out on this home.
Original Mortgage
$187,500
Outstanding Balance
$95,645
Interest Rate
6.01%
Mortgage Type
Purchase Money Mortgage
Estimated Equity
$417,913
Purchase Details
Closed on
Sep 2, 2003
Sold by
Rogers Robert F
Bought by
Torres David
Purchase Details
Closed on
Aug 12, 2003
Sold by
Scire Kathleen M
Bought by
Rogers Robert F
Create a Home Valuation Report for This Property
The Home Valuation Report is an in-depth analysis detailing your home's value as well as a comparison with similar homes in the area
Home Values in the Area
Average Home Value in this Area
Purchase History
| Date | Buyer | Sale Price | Title Company |
|---|---|---|---|
| Odney Samuel | $250,000 | -- | |
| Torres David | $220,000 | -- | |
| Rogers Robert F | $175,000 | -- |
Source: Public Records
Mortgage History
| Date | Status | Borrower | Loan Amount |
|---|---|---|---|
| Open | Rogers Robert F | $187,500 | |
| Closed | Rogers Robert F | $62,500 | |
| Previous Owner | Rogers Robert F | $207,000 |
Source: Public Records
Tax History
| Year | Tax Paid | Tax Assessment Tax Assessment Total Assessment is a certain percentage of the fair market value that is determined by local assessors to be the total taxable value of land and additions on the property. | Land | Improvement |
|---|---|---|---|---|
| 2025 | $4,910 | $473,900 | $175,900 | $298,000 |
| 2024 | $4,716 | $447,900 | $167,100 | $280,800 |
| 2023 | $4,424 | $396,800 | $152,200 | $244,600 |
| 2022 | $4,318 | $347,400 | $130,200 | $217,200 |
| 2021 | $4,237 | $325,200 | $123,200 | $202,000 |
| 2020 | $4,016 | $299,700 | $114,500 | $185,200 |
| 2019 | $3,897 | $272,500 | $98,700 | $173,800 |
| 2018 | $3,559 | $234,900 | $91,200 | $143,700 |
| 2017 | $3,334 | $213,700 | $85,400 | $128,300 |
| 2016 | $3,142 | $194,200 | $73,400 | $120,800 |
| 2015 | $2,920 | $174,300 | $69,700 | $104,600 |
Source: Public Records
Map
Nearby Homes
Your Personal Tour Guide
Ask me questions while you tour the home.