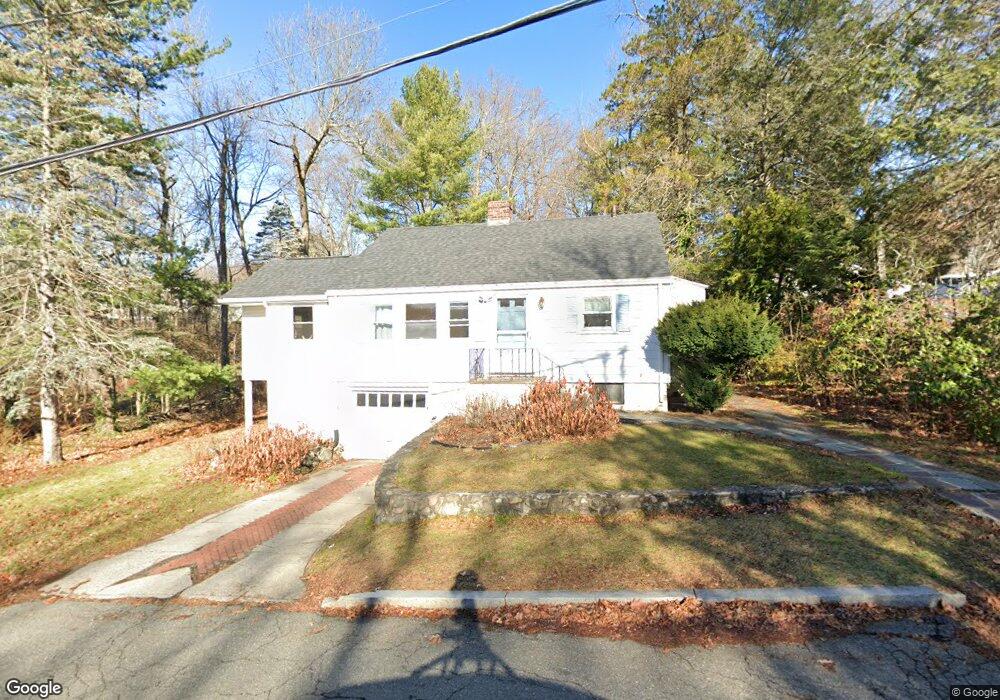
30 James St Unit 1 Winchester, MA 01890
West Side NeighborhoodEstimated Value: $765,000 - $1,089,000
2
Beds
1
Bath
1,200
Sq Ft
$762/Sq Ft
Est. Value
About This Home
This home is located at 30 James St Unit 1, Winchester, MA 01890 and is currently estimated at $914,546, approximately $762 per square foot. 30 James St Unit 1 is a home located in Middlesex County with nearby schools including Vinson-Owen Elementary School, McCall Middle School, and Winchester High School.
Ownership History
Date
Name
Owned For
Owner Type
Purchase Details
Closed on
Jun 14, 2013
Sold by
Boudreau Herbert W
Bought by
Patel Nilesh K
Current Estimated Value
Home Financials for this Owner
Home Financials are based on the most recent Mortgage that was taken out on this home.
Original Mortgage
$206,250
Outstanding Balance
$146,059
Interest Rate
3.39%
Mortgage Type
New Conventional
Estimated Equity
$768,487
Create a Home Valuation Report for This Property
The Home Valuation Report is an in-depth analysis detailing your home's value as well as a comparison with similar homes in the area
Home Values in the Area
Average Home Value in this Area
Purchase History
| Date | Buyer | Sale Price | Title Company |
|---|---|---|---|
| Patel Nilesh K | $275,000 | -- | |
| Patel Nilesh K | $275,000 | -- |
Source: Public Records
Mortgage History
| Date | Status | Borrower | Loan Amount |
|---|---|---|---|
| Open | Patel Nilesh K | $206,250 | |
| Closed | Patel Nilesh K | $206,250 |
Source: Public Records
Tax History Compared to Growth
Tax History
| Year | Tax Paid | Tax Assessment Tax Assessment Total Assessment is a certain percentage of the fair market value that is determined by local assessors to be the total taxable value of land and additions on the property. | Land | Improvement |
|---|---|---|---|---|
| 2025 | $91 | $817,200 | $572,900 | $244,300 |
| 2024 | $9,244 | $815,900 | $572,900 | $243,000 |
| 2023 | $8,930 | $756,800 | $525,200 | $231,600 |
| 2022 | $7,692 | $614,900 | $397,800 | $217,100 |
| 2021 | $6,103 | $607,000 | $389,900 | $217,100 |
| 2020 | $7,521 | $607,000 | $389,900 | $217,100 |
| 2019 | $5,766 | $543,300 | $326,200 | $217,100 |
| 2018 | $11,494 | $515,800 | $310,300 | $205,500 |
| 2017 | $7,693 | $486,300 | $294,400 | $191,900 |
| 2016 | $5,602 | $479,600 | $294,400 | $185,200 |
| 2015 | $5,385 | $443,600 | $266,600 | $177,000 |
| 2014 | $5,092 | $402,200 | $230,700 | $171,500 |
Source: Public Records
Map
Nearby Homes