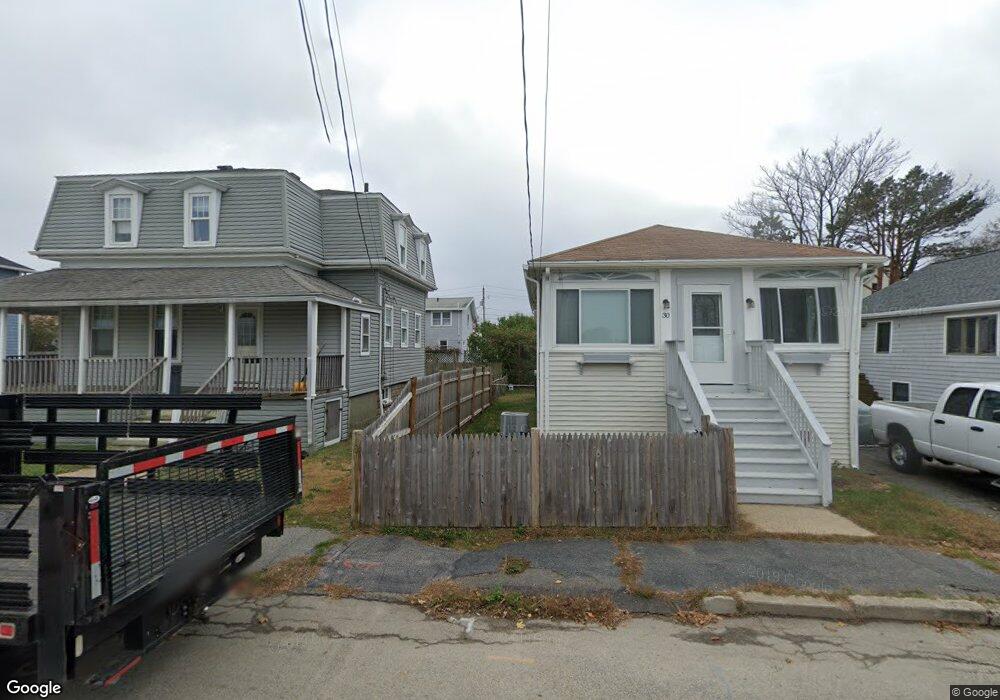
30 L St Hull, MA 02045
The Alphabets NeighborhoodEstimated Value: $539,008 - $617,000
3
Beds
1
Bath
1,262
Sq Ft
$465/Sq Ft
Est. Value
About This Home
This home is located at 30 L St, Hull, MA 02045 and is currently estimated at $586,252, approximately $464 per square foot. 30 L St is a home located in Plymouth County with nearby schools including Lillian M. Jacobs Elementary School, Memorial Middle School, and Hull High School.
Ownership History
Date
Name
Owned For
Owner Type
Purchase Details
Closed on
May 25, 2017
Sold by
Laucka Anita M
Bought by
Anita M Loucka 2017 T M and Anita Laucka
Current Estimated Value
Purchase Details
Closed on
Jul 24, 2008
Sold by
Sullivan Michael P and Hanlon-Sullivan Lisa M
Bought by
Laucka Anita M
Purchase Details
Closed on
Mar 24, 2008
Sold by
Lasalle Bk
Bought by
Sullivan Michael P and Hanlon-Sullivan Lisa M
Purchase Details
Closed on
Mar 19, 2008
Sold by
Lasalle Bank Na
Bought by
Mueller Robert and Mueller Kathryn
Purchase Details
Closed on
Sep 17, 1999
Sold by
Brophy Barry J
Bought by
Mueller Robert and Mueller Kathryn
Purchase Details
Closed on
Oct 1, 1992
Sold by
Fed Natl Mtg Assn
Bought by
Brophy Barry J
Purchase Details
Closed on
Aug 13, 1992
Sold by
Kennon Diane C
Bought by
Federal National Mortgage Association
Create a Home Valuation Report for This Property
The Home Valuation Report is an in-depth analysis detailing your home's value as well as a comparison with similar homes in the area
Home Values in the Area
Average Home Value in this Area
Purchase History
| Date | Buyer | Sale Price | Title Company |
|---|---|---|---|
| Anita M Loucka 2017 T M | -- | -- | |
| Laucka Anita M | $287,000 | -- | |
| Sullivan Michael P | $217,000 | -- | |
| Mueller Robert | $264,000 | -- | |
| Mueller Robert | $142,000 | -- | |
| Brophy Barry J | $68,000 | -- | |
| Brophy Barry J | $68,000 | -- | |
| Federal National Mortgage Association | $95,939 | -- |
Source: Public Records
Mortgage History
| Date | Status | Borrower | Loan Amount |
|---|---|---|---|
| Previous Owner | Federal National Mortgage Association | $17,115 | |
| Previous Owner | Federal National Mortgage Association | $30,000 |
Source: Public Records
Tax History
| Year | Tax Paid | Tax Assessment Tax Assessment Total Assessment is a certain percentage of the fair market value that is determined by local assessors to be the total taxable value of land and additions on the property. | Land | Improvement |
|---|---|---|---|---|
| 2025 | $4,868 | $434,600 | $188,700 | $245,900 |
| 2024 | $4,780 | $410,300 | $180,000 | $230,300 |
| 2023 | $4,521 | $371,500 | $174,200 | $197,300 |
| 2022 | $4,390 | $350,100 | $162,600 | $187,500 |
| 2021 | $4,187 | $330,200 | $145,100 | $185,100 |
| 2020 | $4,010 | $312,800 | $150,900 | $161,900 |
| 2019 | $3,788 | $290,300 | $139,300 | $151,000 |
| 2018 | $5,456 | $271,900 | $139,300 | $132,600 |
| 2017 | $3,581 | $261,000 | $139,300 | $121,700 |
| 2016 | $3,362 | $249,400 | $127,700 | $121,700 |
| 2015 | $3,194 | $229,100 | $107,400 | $121,700 |
| 2014 | $2,952 | $212,800 | $98,700 | $114,100 |
Source: Public Records
Map
Nearby Homes
Your Personal Tour Guide
Ask me questions while you tour the home.