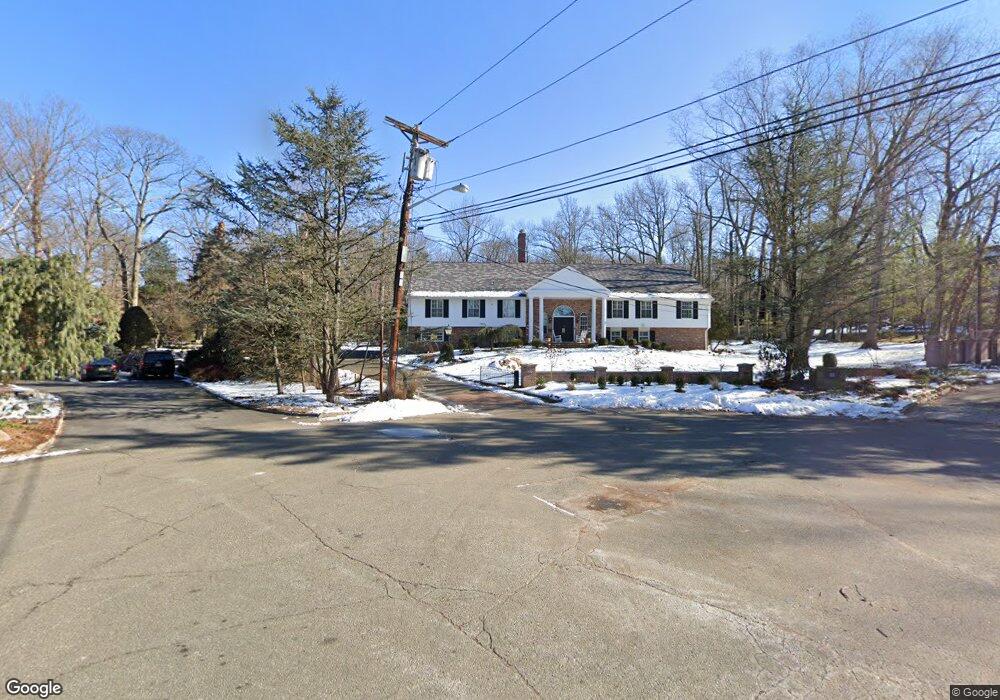
30 Lancaster Rd Tenafly, NJ 07670
Estimated Value: $2,120,000 - $5,203,000
6
Beds
7
Baths
6,764
Sq Ft
$501/Sq Ft
Est. Value
About This Home
This home is located at 30 Lancaster Rd, Tenafly, NJ 07670 and is currently estimated at $3,389,903, approximately $501 per square foot. 30 Lancaster Rd is a home located in Bergen County with nearby schools including Tenafly Middle School, Tenafly High School, and Academy of Our Lady of Mount Carmel.
Ownership History
Date
Name
Owned For
Owner Type
Purchase Details
Closed on
Mar 24, 2021
Sold by
Slevin Ronald and Slevin Joanna
Bought by
Sutton Albert R and Sutton Keiko M
Current Estimated Value
Home Financials for this Owner
Home Financials are based on the most recent Mortgage that was taken out on this home.
Original Mortgage
$1,220,000
Interest Rate
3.1%
Mortgage Type
New Conventional
Purchase Details
Closed on
Jul 27, 2015
Sold by
Slevin Ronald and Slevin Joanna
Bought by
Slevin Ronald and Slevin Joanna
Purchase Details
Closed on
Aug 5, 2014
Sold by
Slevin Joanna and Slevin Ronald
Bought by
Slevin Ronald and Slevin Maury B
Purchase Details
Closed on
Dec 10, 1997
Sold by
Simon Alfred and Simon Barry
Bought by
Slevin Ronald and Slevin Joanna
Home Financials for this Owner
Home Financials are based on the most recent Mortgage that was taken out on this home.
Original Mortgage
$750,000
Interest Rate
7.37%
Create a Home Valuation Report for This Property
The Home Valuation Report is an in-depth analysis detailing your home's value as well as a comparison with similar homes in the area
Home Values in the Area
Average Home Value in this Area
Purchase History
| Date | Buyer | Sale Price | Title Company |
|---|---|---|---|
| Sutton Albert R | $1,525,000 | Vestted Land Services Llc | |
| Slevin Ronald | -- | Title Trust Llc | |
| Slevin Ronald | -- | -- | |
| Slevin Ronald | $1,075,000 | Chicago Title Insurance Co |
Source: Public Records
Mortgage History
| Date | Status | Borrower | Loan Amount |
|---|---|---|---|
| Previous Owner | Sutton Albert R | $1,220,000 | |
| Previous Owner | Slevin Ronald | $750,000 |
Source: Public Records
Tax History
| Year | Tax Paid | Tax Assessment Tax Assessment Total Assessment is a certain percentage of the fair market value that is determined by local assessors to be the total taxable value of land and additions on the property. | Land | Improvement |
|---|---|---|---|---|
| 2025 | $43,325 | $1,530,000 | $1,093,100 | $436,900 |
| 2024 | $42,273 | $1,525,000 | $1,093,100 | $431,900 |
| 2023 | $41,251 | $1,525,000 | $1,093,100 | $431,900 |
| 2022 | $41,251 | $1,525,000 | $1,093,100 | $431,900 |
| 2021 | $40,519 | $1,525,000 | $1,093,100 | $431,900 |
| 2020 | $39,925 | $1,525,000 | $1,093,100 | $431,900 |
| 2019 | $39,223 | $1,525,000 | $1,093,100 | $431,900 |
| 2018 | $47,705 | $1,884,100 | $1,093,100 | $791,000 |
| 2017 | $47,536 | $1,884,100 | $1,093,100 | $791,000 |
| 2016 | $46,594 | $1,884,100 | $1,093,100 | $791,000 |
| 2015 | $45,558 | $1,884,100 | $1,093,100 | $791,000 |
| 2014 | $44,710 | $1,884,100 | $1,093,100 | $791,000 |
Source: Public Records
Map
Nearby Homes
Your Personal Tour Guide
Ask me questions while you tour the home.