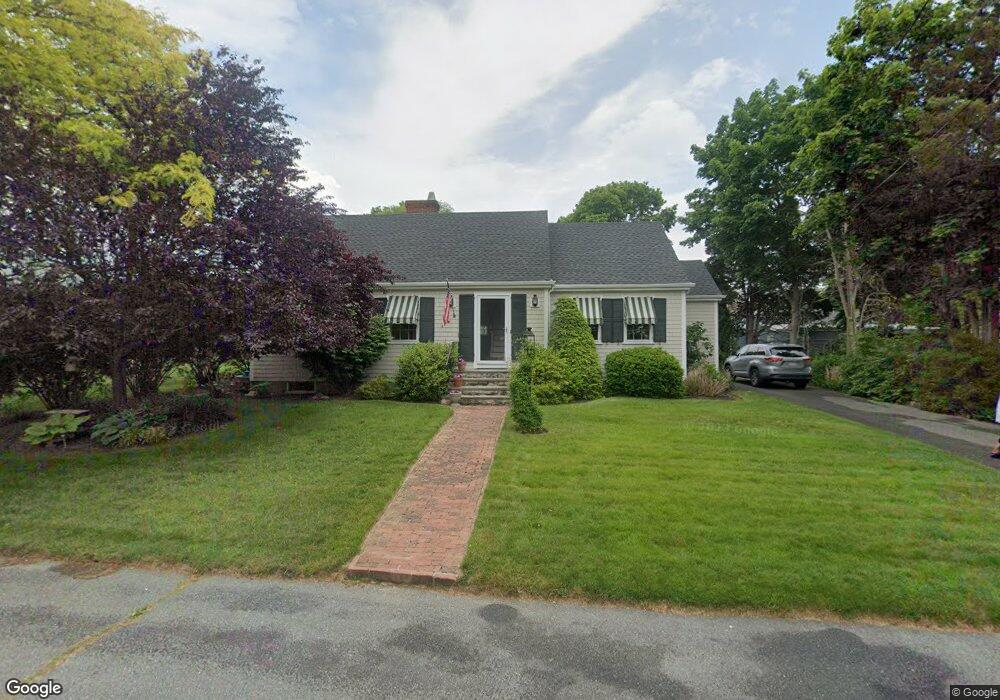
30 Lancaster St New Bedford, MA 02746
Riverside Park NeighborhoodEstimated Value: $502,820 - $596,000
4
Beds
2
Baths
1,982
Sq Ft
$272/Sq Ft
Est. Value
About This Home
This home is located at 30 Lancaster St, New Bedford, MA 02746 and is currently estimated at $539,205, approximately $272 per square foot. 30 Lancaster St is a home located in Bristol County with nearby schools including Carlos Pacheco Elementary School, Keith Middle School, and New Bedford High School.
Ownership History
Date
Name
Owned For
Owner Type
Purchase Details
Closed on
Feb 28, 2023
Sold by
Higham Kevin J and Higham Kathleen
Bought by
Higham Kevin J and Higham Kathleen
Current Estimated Value
Purchase Details
Closed on
Jul 17, 1996
Sold by
Crowley Timothy A and Crowley Cheryl A
Bought by
Higham Kevin J and Higham Kathleen
Home Financials for this Owner
Home Financials are based on the most recent Mortgage that was taken out on this home.
Original Mortgage
$95,200
Interest Rate
8.28%
Mortgage Type
Purchase Money Mortgage
Purchase Details
Closed on
May 18, 1993
Sold by
Crowley Mary E
Bought by
Crowley Timothy A and Belanger Cheryl A
Create a Home Valuation Report for This Property
The Home Valuation Report is an in-depth analysis detailing your home's value as well as a comparison with similar homes in the area
Home Values in the Area
Average Home Value in this Area
Purchase History
| Date | Buyer | Sale Price | Title Company |
|---|---|---|---|
| Higham Kevin J | -- | None Available | |
| Higham Kevin J | -- | None Available | |
| Higham Kevin J | $119,000 | -- | |
| Higham Kevin J | $119,000 | -- | |
| Crowley Timothy A | $120,000 | -- | |
| Crowley Timothy A | $120,000 | -- |
Source: Public Records
Mortgage History
| Date | Status | Borrower | Loan Amount |
|---|---|---|---|
| Previous Owner | Crowley Timothy A | $120,000 | |
| Previous Owner | Crowley Timothy A | $94,000 | |
| Previous Owner | Crowley Timothy A | $95,200 |
Source: Public Records
Tax History
| Year | Tax Paid | Tax Assessment Tax Assessment Total Assessment is a certain percentage of the fair market value that is determined by local assessors to be the total taxable value of land and additions on the property. | Land | Improvement |
|---|---|---|---|---|
| 2025 | $5,580 | $493,400 | $147,400 | $346,000 |
| 2024 | $5,652 | $471,000 | $152,400 | $318,600 |
| 2023 | $5,795 | $405,500 | $121,900 | $283,600 |
| 2022 | $5,347 | $344,100 | $116,900 | $227,200 |
| 2021 | $5,154 | $330,600 | $111,800 | $218,800 |
| 2020 | $4,984 | $308,400 | $111,800 | $196,600 |
| 2019 | $4,819 | $292,600 | $111,800 | $180,800 |
| 2018 | $4,503 | $270,800 | $111,800 | $159,000 |
| 2017 | $4,167 | $249,700 | $106,700 | $143,000 |
| 2016 | $3,880 | $235,300 | $101,600 | $133,700 |
| 2015 | $3,615 | $229,800 | $101,600 | $128,200 |
| 2014 | $3,482 | $229,700 | $104,200 | $125,500 |
Source: Public Records
Map
Nearby Homes
- 220 Mount Vernon St
- 290 Mount Pleasant St Unit 292
- 105 Dewolf St
- SS Mount Vernon St
- 0 Fillmore St
- 228-230 Mount Pleasant St
- 570 Shawmut Ave
- 87 Adams St
- 30 Nashua St
- 345 Gardner St
- 96 Mount Pleasant St
- 707 Hathaway Rd
- 69 Myrtle St
- 264 Weld St
- 41 Tilton St
- 377 Earle St
- 20 Lafrance Ct
- 21 Reynolds St
- 5 Tilton St
- 124 Shawmut Ave
Your Personal Tour Guide
Ask me questions while you tour the home.