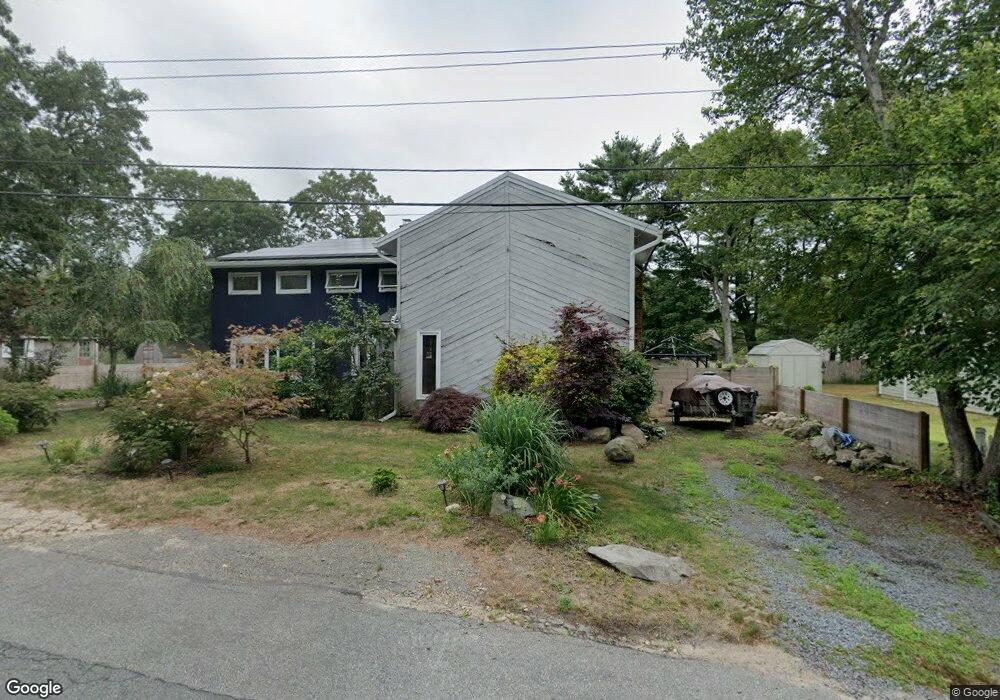
30 Leen Rd Pocasset, MA 02559
Estimated Value: $704,381 - $760,000
4
Beds
3
Baths
2,701
Sq Ft
$275/Sq Ft
Est. Value
About This Home
This home is located at 30 Leen Rd, Pocasset, MA 02559 and is currently estimated at $743,095, approximately $275 per square foot. 30 Leen Rd is a home located in Barnstable County with nearby schools including Bourne High School, Cadence Academy Preschool - Bourne, and St Margaret Regional School.
Ownership History
Date
Name
Owned For
Owner Type
Purchase Details
Closed on
Jun 15, 1994
Sold by
Chapman John J
Bought by
Collette Robert D and Collett Phyllis A
Current Estimated Value
Purchase Details
Closed on
Mar 25, 1991
Sold by
Payton Alvin E
Bought by
Alliance Funding Co
Create a Home Valuation Report for This Property
The Home Valuation Report is an in-depth analysis detailing your home's value as well as a comparison with similar homes in the area
Home Values in the Area
Average Home Value in this Area
Purchase History
| Date | Buyer | Sale Price | Title Company |
|---|---|---|---|
| Collette Robert D | $149,000 | -- | |
| Collette Robert D | $149,000 | -- | |
| Alliance Funding Co | $70,500 | -- | |
| Alliance Funding Co | $70,500 | -- |
Source: Public Records
Mortgage History
| Date | Status | Borrower | Loan Amount |
|---|---|---|---|
| Open | Alliance Funding Co | $50,000 | |
| Closed | Alliance Funding Co | $39,400 |
Source: Public Records
Tax History Compared to Growth
Tax History
| Year | Tax Paid | Tax Assessment Tax Assessment Total Assessment is a certain percentage of the fair market value that is determined by local assessors to be the total taxable value of land and additions on the property. | Land | Improvement |
|---|---|---|---|---|
| 2025 | $4,925 | $630,600 | $192,900 | $437,700 |
| 2024 | $4,949 | $617,100 | $200,400 | $416,700 |
| 2023 | $4,811 | $546,100 | $177,300 | $368,800 |
| 2022 | $4,403 | $436,400 | $143,800 | $292,600 |
| 2021 | $4,279 | $397,300 | $130,900 | $266,400 |
| 2020 | $4,157 | $387,100 | $129,700 | $257,400 |
| 2019 | $4,473 | $425,600 | $129,700 | $295,900 |
| 2018 | $4,331 | $410,900 | $129,100 | $281,800 |
| 2017 | $4,142 | $402,100 | $127,900 | $274,200 |
| 2016 | $3,681 | $362,300 | $127,900 | $234,400 |
| 2015 | $3,257 | $323,400 | $89,000 | $234,400 |
Source: Public Records
Map
Nearby Homes
- 7 4th Ave
- 15 1st St
- 940 County Rd
- 174 Barlows Landing Rd
- 940 County Rd
- 709 County Rd
- 254 Barlows Landing Rd
- 39 Bennets Neck Dr
- 606 County Rd
- 1094 County Rd
- 3 Red Brook Pond Dr
- 22 Nairn Rd
- 48 Red Brook Harbor Rd
- 14 Navajo Rd
- 34 Kenwood Rd
- 70 Wings Neck Rd
- 45 Kenwood Rd
- 1234 Route 28a
- 501 County Rd
- 1234 Route 28a