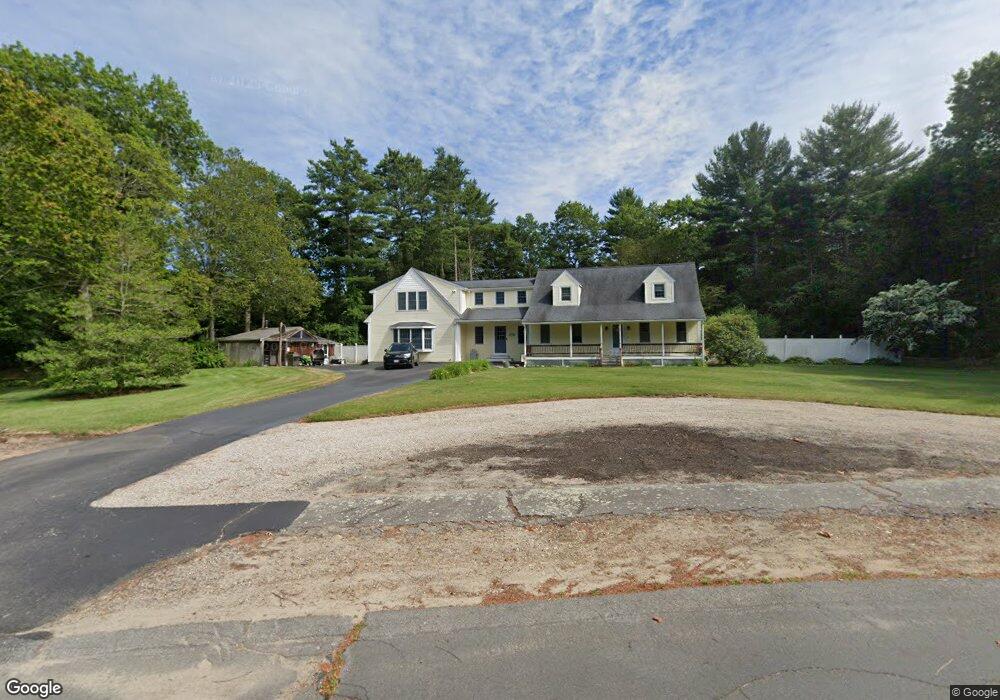
30 Lillypond Ln Halifax, MA 02338
Estimated Value: $743,250 - $834,000
3
Beds
2
Baths
2,808
Sq Ft
$280/Sq Ft
Est. Value
About This Home
This home is located at 30 Lillypond Ln, Halifax, MA 02338 and is currently estimated at $786,063, approximately $279 per square foot. 30 Lillypond Ln is a home located in Plymouth County with nearby schools including Silver Lake Regional High School, Halifax Elementary School, and Silver Lake Regional Middle School.
Ownership History
Date
Name
Owned For
Owner Type
Purchase Details
Closed on
Mar 21, 2025
Sold by
Fitzpatrick Robert A and Fitzpatrick Susan L
Bought by
Fitzpatrick
Current Estimated Value
Purchase Details
Closed on
Jan 15, 1991
Sold by
Halifax Cranberry Prod
Bought by
Fitzpatrick Robert A and Fitzpatrick Susan L
Create a Home Valuation Report for This Property
The Home Valuation Report is an in-depth analysis detailing your home's value as well as a comparison with similar homes in the area
Home Values in the Area
Average Home Value in this Area
Purchase History
| Date | Buyer | Sale Price | Title Company |
|---|---|---|---|
| Fitzpatrick | -- | None Available | |
| Fitzpatrick | -- | None Available | |
| Fitzpatrick Robert A | $149,000 | -- |
Source: Public Records
Mortgage History
| Date | Status | Borrower | Loan Amount |
|---|---|---|---|
| Previous Owner | Fitzpatrick Robert A | $250,000 | |
| Previous Owner | Fitzpatrick Robert A | $60,000 | |
| Previous Owner | Fitzpatrick Robert A | $30,000 |
Source: Public Records
Tax History Compared to Growth
Tax History
| Year | Tax Paid | Tax Assessment Tax Assessment Total Assessment is a certain percentage of the fair market value that is determined by local assessors to be the total taxable value of land and additions on the property. | Land | Improvement |
|---|---|---|---|---|
| 2025 | $9,198 | $644,600 | $191,200 | $453,400 |
| 2024 | $9,016 | $626,100 | $183,900 | $442,200 |
| 2023 | $8,903 | $598,300 | $178,500 | $419,800 |
| 2022 | $8,565 | $535,000 | $159,400 | $375,600 |
| 2021 | $8,385 | $482,200 | $153,200 | $329,000 |
| 2020 | $8,117 | $465,400 | $153,200 | $312,200 |
| 2019 | $7,968 | $456,100 | $148,800 | $307,300 |
| 2018 | $7,671 | $434,600 | $140,400 | $294,200 |
| 2017 | $7,634 | $412,000 | $140,400 | $271,600 |
| 2016 | $7,238 | $376,000 | $118,800 | $257,200 |
| 2015 | $7,199 | $379,100 | $118,800 | $260,300 |
Source: Public Records
Map
Nearby Homes
- 34 Highland Cir
- 0 Morse St Unit 73387111
- 228 Thompson St
- 198 Thompson St
- 234 River St
- 10 Old Summit St
- 40 Old Summit St
- 26 Old Summit St
- 53 Elm St
- 25 Dominique Dr
- 74 Magnolia Way
- 8 Hilda Ln
- 211 Elm St
- 129 Franklin St
- 118 Lingan St
- 22 Hudson St
- 93,97,105 Hayward St
- 20 Quail Run Rd
- 2 Edgewood Cir
- 904 Auburn St
- 40 Lillypond Ln
- 50 Firefly Rd
- 45 Lillypond Ln
- 20 Lillypond Ln
- 25 Lillypond Ln
- 402 Thompson St
- 38 Firefly Rd
- 386 Thompson St
- 50 Lillypond Ln
- 396 Thompson St
- 15 Lillypond Ln
- 412 Thompson St
- 59 Firefly Rd
- 49 Firefly Rd
- 9 Lillypond Ln
- 10 Lillypond Ln
- 389 Thompson St
- 39 Firefly Rd
- 384 Thompson St
- 29 Firefly Rd