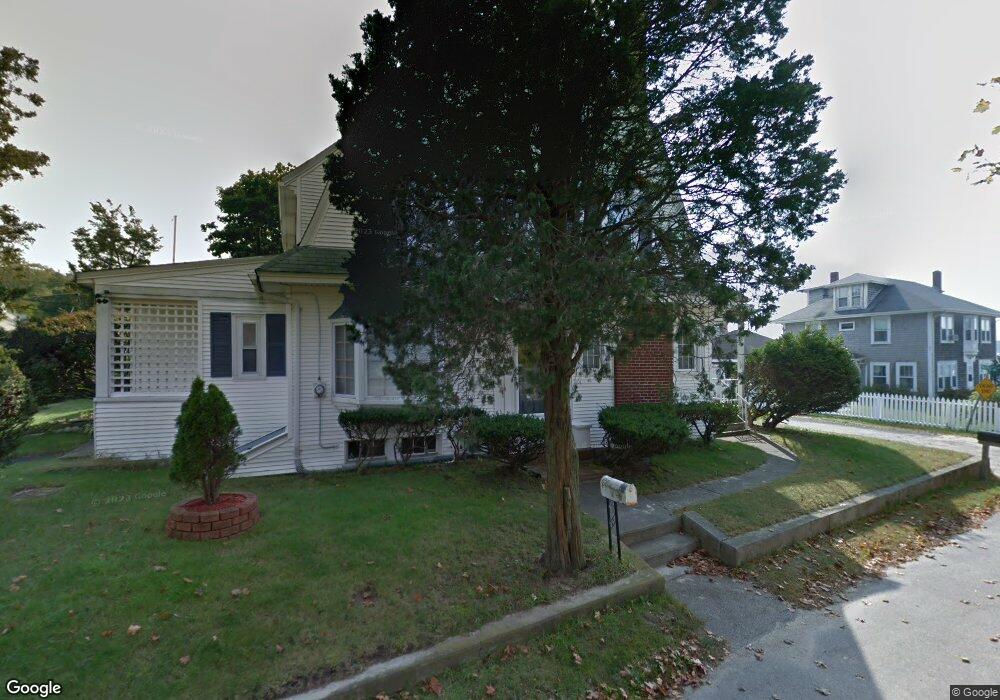
30 Maple St Bourne, MA 02532
Monument Beach NeighborhoodEstimated Value: $425,156 - $514,000
3
Beds
1
Bath
650
Sq Ft
$704/Sq Ft
Est. Value
About This Home
This home is located at 30 Maple St, Bourne, MA 02532 and is currently estimated at $457,539, approximately $703 per square foot. 30 Maple St is a home located in Barnstable County with nearby schools including Bourne High School, St Margaret Regional School, and Cadence Academy Preschool - Bourne.
Ownership History
Date
Name
Owned For
Owner Type
Purchase Details
Closed on
Nov 19, 1993
Sold by
Margeson Florence E and Margeson Hector
Bought by
Flanders Albert G and Flanders Thelma J
Current Estimated Value
Home Financials for this Owner
Home Financials are based on the most recent Mortgage that was taken out on this home.
Original Mortgage
$56,000
Interest Rate
6.77%
Mortgage Type
Purchase Money Mortgage
Create a Home Valuation Report for This Property
The Home Valuation Report is an in-depth analysis detailing your home's value as well as a comparison with similar homes in the area
Home Values in the Area
Average Home Value in this Area
Purchase History
| Date | Buyer | Sale Price | Title Company |
|---|---|---|---|
| Flanders Albert G | $70,000 | -- | |
| Flanders Albert G | $70,000 | -- |
Source: Public Records
Mortgage History
| Date | Status | Borrower | Loan Amount |
|---|---|---|---|
| Closed | Flanders Albert G | $56,000 |
Source: Public Records
Tax History
| Year | Tax Paid | Tax Assessment Tax Assessment Total Assessment is a certain percentage of the fair market value that is determined by local assessors to be the total taxable value of land and additions on the property. | Land | Improvement |
|---|---|---|---|---|
| 2025 | $2,859 | $366,100 | $183,500 | $182,600 |
| 2024 | $2,797 | $348,700 | $174,800 | $173,900 |
| 2023 | $2,719 | $308,600 | $154,700 | $153,900 |
| 2022 | $2,565 | $254,200 | $136,900 | $117,300 |
| 2021 | $2,492 | $231,400 | $124,600 | $106,800 |
| 2020 | $2,411 | $224,500 | $123,400 | $101,100 |
| 2019 | $0 | $218,900 | $123,400 | $95,500 |
| 2018 | $2,148 | $203,800 | $117,500 | $86,300 |
| 2017 | $0 | $201,900 | $116,400 | $85,500 |
| 2016 | $2,010 | $197,800 | $116,400 | $81,400 |
| 2015 | $1,992 | $197,800 | $116,400 | $81,400 |
Source: Public Records
Map
Nearby Homes
- 203 County Rd
- 566 Shore Rd
- 16 Amberwood Ct
- 13 Laurel Hill Ct
- 12 Turnberry Rd Unit 12
- 4 Harbor Hill Dr
- 35 Benedict Rd
- 5 Sea Knoll Ct
- 20 Colony Ave
- 5 Zoli Ln
- 4 Hollyhock Knoll Ct Unit 4
- 4 Hollyhock Knoll Ct Unit 4
- 14 Navajo Rd
- 44 Cotuit Rd
- 60 Bourne Neck Dr
- 709 County Rd
- 254 Barlows Landing Rd
- 3 1st St
- 60 Sandwich Rd
- 10 Sandy Ln
Your Personal Tour Guide
Ask me questions while you tour the home.