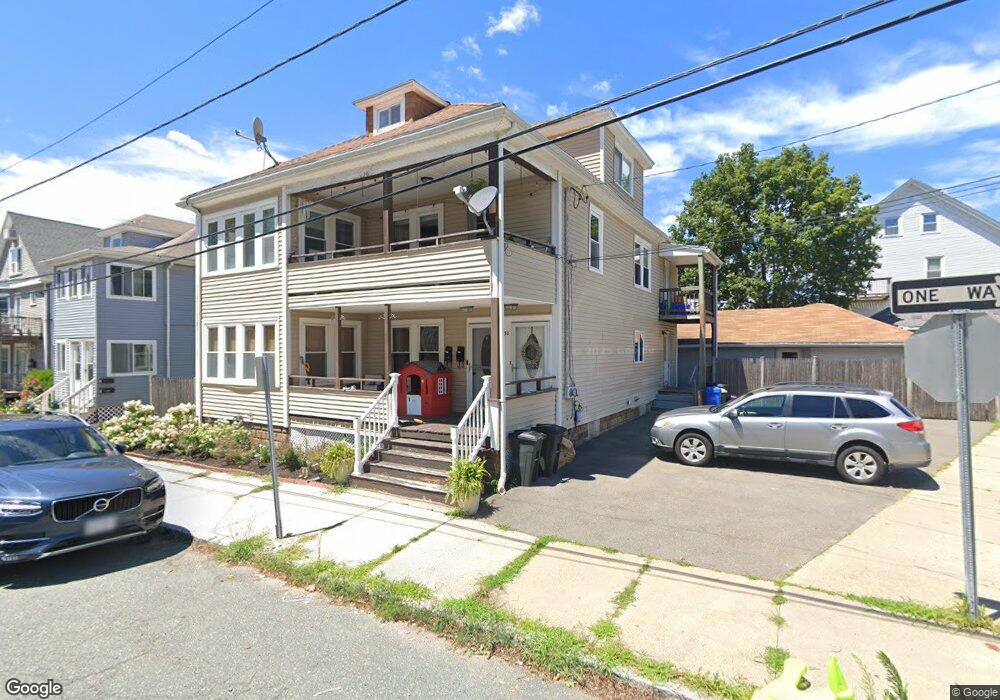
30 Mason St Unit 1 Beverly, MA 01915
Gloucester Crossing NeighborhoodEstimated Value: $361,000 - $477,000
2
Beds
1
Bath
1,099
Sq Ft
$380/Sq Ft
Est. Value
About This Home
This home is located at 30 Mason St Unit 1, Beverly, MA 01915 and is currently estimated at $417,502, approximately $379 per square foot. 30 Mason St Unit 1 is a home located in Essex County with nearby schools including Beverly High School, Shore Country Day School, and The Saints Academy.
Ownership History
Date
Name
Owned For
Owner Type
Purchase Details
Closed on
Mar 25, 2022
Sold by
Boraiza Matthew
Bought by
Boraiza Matthew and Boraiza Vicki
Current Estimated Value
Home Financials for this Owner
Home Financials are based on the most recent Mortgage that was taken out on this home.
Original Mortgage
$176,000
Outstanding Balance
$164,146
Interest Rate
3.92%
Mortgage Type
New Conventional
Estimated Equity
$253,356
Purchase Details
Closed on
Jul 14, 2011
Sold by
Fhlmc
Bought by
Boraiza Matthew
Home Financials for this Owner
Home Financials are based on the most recent Mortgage that was taken out on this home.
Original Mortgage
$109,600
Interest Rate
4.58%
Mortgage Type
Purchase Money Mortgage
Purchase Details
Closed on
Jun 8, 2010
Sold by
Bagley Kimberly and Gmac Mortgage Llc
Bought by
Fhlmc
Purchase Details
Closed on
Mar 24, 2005
Sold by
Lapointe Marc A
Bought by
Bagley Kimberly
Create a Home Valuation Report for This Property
The Home Valuation Report is an in-depth analysis detailing your home's value as well as a comparison with similar homes in the area
Home Values in the Area
Average Home Value in this Area
Purchase History
We collect this data history from publicly available records. To have your information removed, we recommend requesting removal directly through your county’s website.
| Date | Buyer | Sale Price | Title Company |
|---|---|---|---|
| Boraiza Matthew | -- | None Available | |
| Boraiza Matthew | -- | None Available | |
| Boraiza Matthew | -- | None Available | |
| Boraiza Matthew | $137,000 | -- | |
| Boraiza Matthew | $137,000 | -- | |
| Fhlmc | $173,700 | -- | |
| Fhlmc | $173,700 | -- | |
| Bagley Kimberly | $262,500 | -- | |
| Bagley Kimberly | $262,500 | -- |
Source: Public Records
Mortgage History
We collect this data history from publicly available records. To have your information removed, we recommend requesting removal directly through your county’s website.
| Date | Status | Borrower | Loan Amount |
|---|---|---|---|
| Open | Boraiza Matthew | $176,000 | |
| Closed | Boraiza Matthew | $176,000 | |
| Previous Owner | Bagley Kimberly | $109,600 |
Source: Public Records
Tax History
| Year | Tax Paid | Tax Assessment Tax Assessment Total Assessment is a certain percentage of the fair market value that is determined by local assessors to be the total taxable value of land and additions on the property. | Land | Improvement |
|---|---|---|---|---|
| 2025 | $3,462 | $315,000 | $0 | $315,000 |
| 2024 | $3,267 | $290,900 | $0 | $290,900 |
| 2023 | $3,002 | $266,600 | $0 | $266,600 |
| 2022 | $3,049 | $250,500 | $0 | $250,500 |
| 2021 | $2,960 | $233,100 | $0 | $233,100 |
| 2020 | $2,751 | $214,400 | $0 | $214,400 |
| 2019 | $2,651 | $200,700 | $0 | $200,700 |
| 2018 | $2,519 | $185,200 | $0 | $185,200 |
| 2017 | $2,535 | $177,500 | $0 | $177,500 |
| 2016 | $2,511 | $174,500 | $0 | $174,500 |
| 2015 | $2,462 | $174,500 | $0 | $174,500 |
Source: Public Records
Map
Nearby Homes
- 17 Ames St
- 2 Mill St
- 21 Whitney Ave Unit 1
- 492 Cabot St Unit 1A
- 5 Beckford St Unit 3
- 501 Cabot St Unit 2
- 50 Balch St Unit 111
- 50 Balch St Unit 405
- 50 Balch St Unit 309
- 50 Balch St Unit 303
- 37 Chase St
- 526 Cabot St
- 5 Palmer Rd
- 348 Rantoul St Unit 202
- 8 Baker Ave
- 18 James St
- 32 Lexington Dr
- 44 Charnock St
- 22 Butman St Unit 1
- 17 Kernwood Heights
Your Personal Tour Guide
Ask me questions while you tour the home.