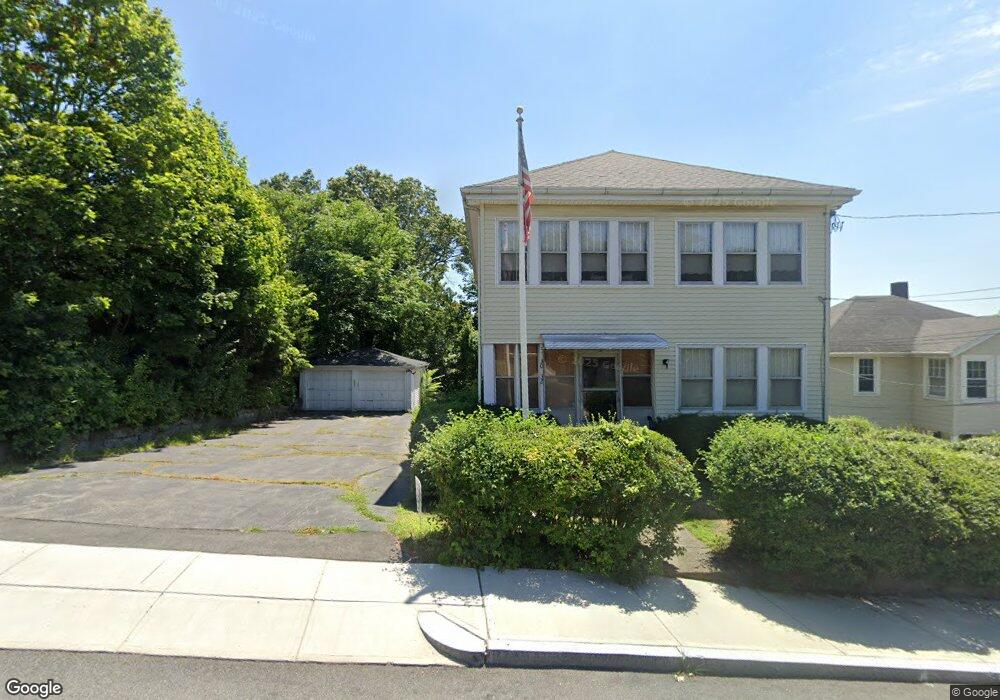
30 Morton St Quincy, MA 02169
South Quincy NeighborhoodEstimated Value: $820,000 - $950,000
4
Beds
2
Baths
2,447
Sq Ft
$371/Sq Ft
Est. Value
About This Home
This home is located at 30 Morton St, Quincy, MA 02169 and is currently estimated at $907,739, approximately $370 per square foot. 30 Morton St is a home located in Norfolk County with nearby schools including South West Middle School, Lincoln-Hancock Community School, and Quincy High School.
Ownership History
Date
Name
Owned For
Owner Type
Purchase Details
Closed on
Mar 30, 2006
Sold by
Darigo Antoinette
Bought by
Darigo Steven and Darigo Antoinette
Current Estimated Value
Purchase Details
Closed on
Feb 24, 1997
Sold by
Est Pusateri Anthony J and Pusateri Mary E
Bought by
Darigo Antoinette and Darigo Steven
Home Financials for this Owner
Home Financials are based on the most recent Mortgage that was taken out on this home.
Original Mortgage
$48,000
Interest Rate
7.8%
Mortgage Type
Purchase Money Mortgage
Create a Home Valuation Report for This Property
The Home Valuation Report is an in-depth analysis detailing your home's value as well as a comparison with similar homes in the area
Home Values in the Area
Average Home Value in this Area
Purchase History
| Date | Buyer | Sale Price | Title Company |
|---|---|---|---|
| Darigo Steven | -- | -- | |
| Darigo Antoinette | $88,000 | -- |
Source: Public Records
Mortgage History
| Date | Status | Borrower | Loan Amount |
|---|---|---|---|
| Previous Owner | Darigo Antoinette | $48,000 |
Source: Public Records
Tax History Compared to Growth
Tax History
| Year | Tax Paid | Tax Assessment Tax Assessment Total Assessment is a certain percentage of the fair market value that is determined by local assessors to be the total taxable value of land and additions on the property. | Land | Improvement |
|---|---|---|---|---|
| 2025 | $9,224 | $800,000 | $315,600 | $484,400 |
| 2024 | $8,686 | $770,700 | $300,800 | $469,900 |
| 2023 | $8,118 | $729,400 | $274,000 | $455,400 |
| 2022 | $7,896 | $659,100 | $229,200 | $429,900 |
| 2021 | $7,784 | $641,200 | $229,200 | $412,000 |
| 2020 | $7,725 | $621,500 | $229,200 | $392,300 |
| 2019 | $7,373 | $587,500 | $216,600 | $370,900 |
| 2018 | $6,923 | $519,000 | $201,000 | $318,000 |
| 2017 | $6,982 | $492,700 | $191,600 | $301,100 |
| 2016 | $6,166 | $429,400 | $167,400 | $262,000 |
| 2015 | $6,074 | $416,000 | $167,400 | $248,600 |
| 2014 | $5,385 | $362,400 | $167,400 | $195,000 |
Source: Public Records
Map
Nearby Homes
- 57 Buckley St
- 57A West St
- 72 Centre St Unit J
- 42 West St
- 211 Copeland St
- 46 Suomi Rd
- 46 Suomi Rd Unit 46
- 14 Arthur Ave
- 12 Arthur Ave
- 55 Station St Unit 1
- 21 Arthur St
- 41 Filbert St
- 36 Greystone St Unit 36
- 64 Garfield St Unit B
- 1 Cityview Ln Unit 506
- 1 Cityview Ln Unit 210
- 1 Cityview Ln Unit 204
- 2 Ricciuti Dr Unit 8
- 328 Copeland St Unit 3E
- 203 Centre St
- 34 Morton St
- 36 Morton St
- 34 Morton St Unit 2
- 34 Morton St Unit 34
- 26 Morton St
- 38 Morton St
- 42 Morton St
- 42 Morton St Unit 2
- 117A Copeland St
- 129-131 Copeland St
- 129 Copeland St
- 129 Copeland St Unit 129
- 133 Copeland St
- 18 Morton St
- 131 Copeland St Unit 131
- 131 Copeland St
- 131 Copeland St Unit 2
- 300 Common St
- 300 Common St Unit 1
- 302 Common St Unit 1