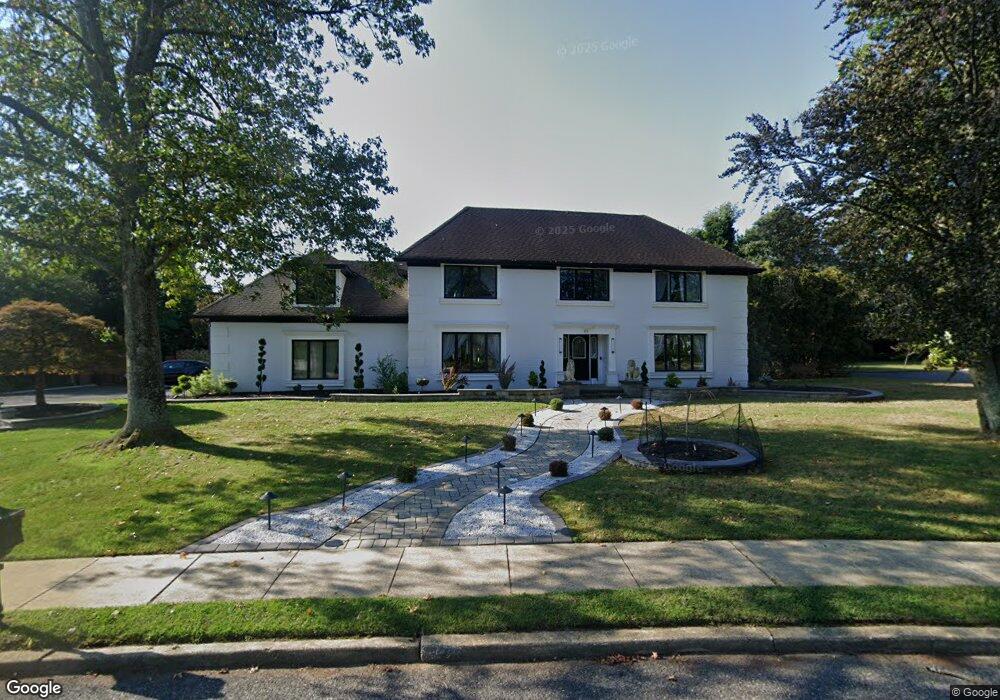
30 Muncy Dr West Long Branch, NJ 07764
Estimated Value: $1,695,000 - $1,927,000
4
Beds
3
Baths
3,214
Sq Ft
$561/Sq Ft
Est. Value
About This Home
This home is located at 30 Muncy Dr, West Long Branch, NJ 07764 and is currently estimated at $1,803,160, approximately $561 per square foot. 30 Muncy Dr is a home located in Monmouth County with nearby schools including Betty McElmon Elementary School, Frank Antonides School, and Shore Regional High School.
Ownership History
Date
Name
Owned For
Owner Type
Purchase Details
Closed on
Apr 11, 2022
Sold by
Marchese Kathleen
Bought by
Marchese Joseph
Current Estimated Value
Purchase Details
Closed on
Jul 17, 2008
Sold by
Borriello Christopher M and Borriello Michelle E
Bought by
Marchese Joseph and Marchese Kathleen
Home Financials for this Owner
Home Financials are based on the most recent Mortgage that was taken out on this home.
Original Mortgage
$850,000
Interest Rate
5%
Mortgage Type
Purchase Money Mortgage
Purchase Details
Closed on
Jun 14, 2004
Sold by
Ulanet Seth
Bought by
Borriello Christopher and Borriello Michele
Home Financials for this Owner
Home Financials are based on the most recent Mortgage that was taken out on this home.
Original Mortgage
$450,000
Interest Rate
6.3%
Create a Home Valuation Report for This Property
The Home Valuation Report is an in-depth analysis detailing your home's value as well as a comparison with similar homes in the area
Home Values in the Area
Average Home Value in this Area
Purchase History
| Date | Buyer | Sale Price | Title Company |
|---|---|---|---|
| Marchese Joseph | -- | None Listed On Document | |
| Redacted Upon Request | -- | None Listed On Document | |
| Marchese Joseph | $850,000 | Stewart Title Guaranty Co | |
| Borriello Christopher | $750,000 | -- |
Source: Public Records
Mortgage History
| Date | Status | Borrower | Loan Amount |
|---|---|---|---|
| Previous Owner | Marchese Joseph | $850,000 | |
| Previous Owner | Borriello Christopher | $450,000 |
Source: Public Records
Tax History Compared to Growth
Tax History
| Year | Tax Paid | Tax Assessment Tax Assessment Total Assessment is a certain percentage of the fair market value that is determined by local assessors to be the total taxable value of land and additions on the property. | Land | Improvement |
|---|---|---|---|---|
| 2025 | $19,179 | $1,627,000 | $914,500 | $712,500 |
| 2024 | $17,970 | $1,471,900 | $772,500 | $699,400 |
| 2023 | $17,970 | $1,286,300 | $678,000 | $608,300 |
| 2022 | $15,974 | $1,140,400 | $561,200 | $579,200 |
| 2021 | $15,974 | $826,400 | $311,200 | $515,200 |
| 2020 | $16,271 | $791,800 | $288,300 | $503,500 |
| 2019 | $16,125 | $788,900 | $288,300 | $500,600 |
| 2018 | $14,380 | $679,600 | $270,900 | $408,700 |
| 2017 | $13,626 | $614,900 | $218,600 | $396,300 |
| 2016 | $14,224 | $654,900 | $296,500 | $358,400 |
| 2015 | $14,042 | $645,600 | $296,500 | $349,100 |
| 2014 | $14,811 | $635,400 | $276,500 | $358,900 |
Source: Public Records
Map
Nearby Homes