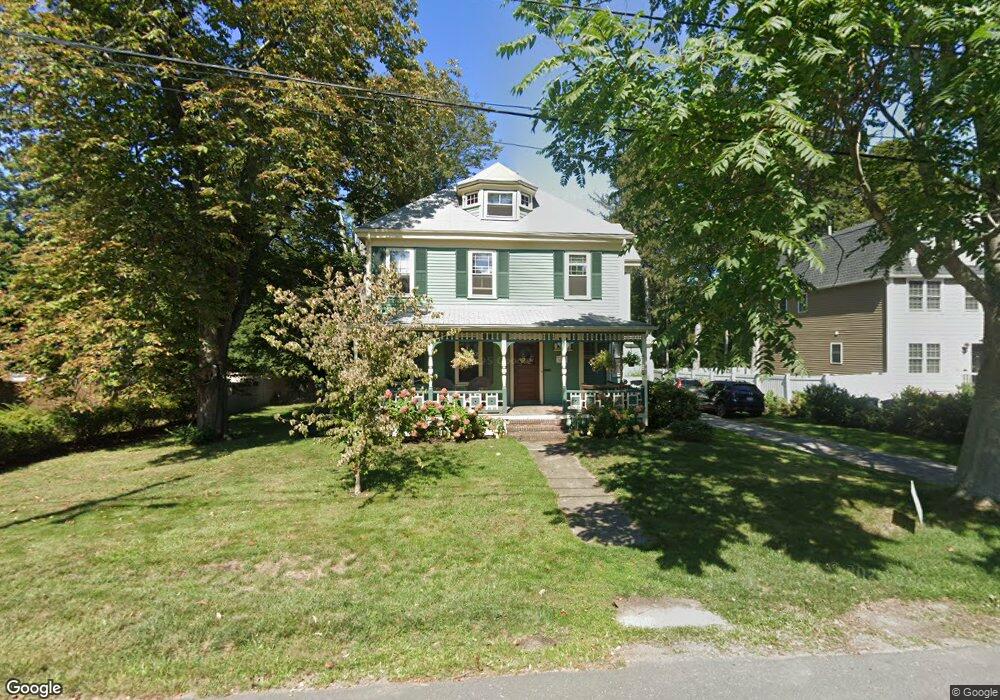
30 Myrtle St Braintree, MA 02184
East Braintree NeighborhoodEstimated Value: $817,000 - $942,000
5
Beds
2
Baths
2,447
Sq Ft
$361/Sq Ft
Est. Value
About This Home
This home is located at 30 Myrtle St, Braintree, MA 02184 and is currently estimated at $882,646, approximately $360 per square foot. 30 Myrtle St is a home located in Norfolk County with nearby schools including Braintree High School, Step Ahead Kindergarten, and Meeting House Montessori School.
Ownership History
Date
Name
Owned For
Owner Type
Purchase Details
Closed on
Aug 3, 2009
Sold by
Anderson Ellen M
Bought by
Barney Christopher D and Barney Jane T
Current Estimated Value
Home Financials for this Owner
Home Financials are based on the most recent Mortgage that was taken out on this home.
Original Mortgage
$347,018
Interest Rate
5.43%
Mortgage Type
Purchase Money Mortgage
Purchase Details
Closed on
Apr 30, 1997
Sold by
Eastman Lawrence J and Eastman Marua C
Bought by
Aliberti Katherine L
Home Financials for this Owner
Home Financials are based on the most recent Mortgage that was taken out on this home.
Original Mortgage
$137,000
Interest Rate
7.85%
Mortgage Type
Purchase Money Mortgage
Create a Home Valuation Report for This Property
The Home Valuation Report is an in-depth analysis detailing your home's value as well as a comparison with similar homes in the area
Home Values in the Area
Average Home Value in this Area
Purchase History
| Date | Buyer | Sale Price | Title Company |
|---|---|---|---|
| Barney Christopher D | $359,000 | -- | |
| Anderson Joyce E | -- | -- | |
| Aliberti Katherine L | $147,000 | -- | |
| Aliberti Katherine L | $147,000 | -- |
Source: Public Records
Mortgage History
| Date | Status | Borrower | Loan Amount |
|---|---|---|---|
| Open | Aliberti Katherine L | $342,768 | |
| Closed | Barney Christopher D | $347,018 | |
| Previous Owner | Aliberti Katherine L | $137,000 |
Source: Public Records
Tax History
| Year | Tax Paid | Tax Assessment Tax Assessment Total Assessment is a certain percentage of the fair market value that is determined by local assessors to be the total taxable value of land and additions on the property. | Land | Improvement |
|---|---|---|---|---|
| 2025 | $7,746 | $776,200 | $362,300 | $413,900 |
| 2024 | $7,101 | $749,100 | $337,800 | $411,300 |
| 2023 | $6,268 | $642,200 | $303,600 | $338,600 |
| 2022 | $6,097 | $612,800 | $274,200 | $338,600 |
| 2021 | $5,636 | $566,400 | $247,700 | $318,700 |
| 2020 | $5,226 | $530,000 | $225,200 | $304,800 |
| 2019 | $5,057 | $501,200 | $215,400 | $285,800 |
| 2018 | $4,962 | $470,800 | $195,800 | $275,000 |
| 2017 | $4,779 | $445,000 | $186,000 | $259,000 |
| 2016 | $4,444 | $404,700 | $156,700 | $248,000 |
| 2015 | $4,358 | $393,700 | $154,700 | $239,000 |
| 2014 | $4,134 | $362,000 | $141,000 | $221,000 |
Source: Public Records
Map
Nearby Homes
- 30 Church St Unit 4
- 255 River St
- 50 Cleveland Ave
- 17 White Rd
- 491 Washington St Unit 1
- 36 Chestnut Ave
- 9 Independence Ave Unit 307
- 29 Joseph Rd
- 26 Tingley Rd
- 583 Union St
- 6 Oak St
- 5 Woodsum Dr Unit 12
- 192 Federal Ave Unit B
- 298 Lisle St
- 51 Faxon St
- 31 Doris Rd
- 10 Skyline Dr Unit 5
- 312 Shaw St
- 36 Independence Ave Unit 1
- 177 Franklin St
Your Personal Tour Guide
Ask me questions while you tour the home.