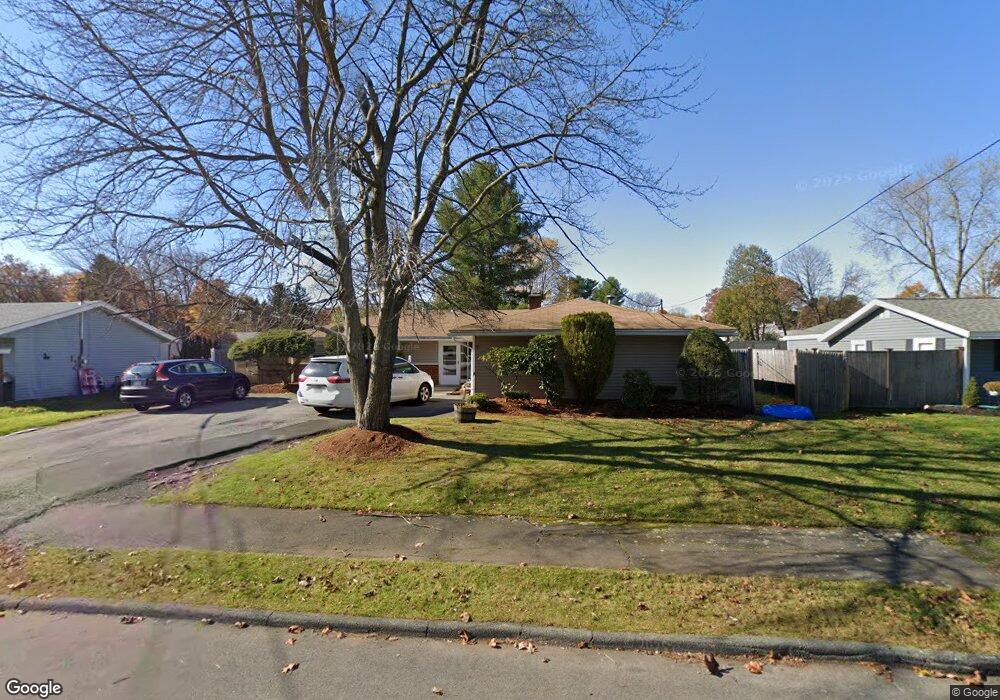
30 N Belgian Rd Danvers, MA 01923
Estimated Value: $661,000 - $745,000
5
Beds
2
Baths
2,056
Sq Ft
$346/Sq Ft
Est. Value
About This Home
This home is located at 30 N Belgian Rd, Danvers, MA 01923 and is currently estimated at $711,235, approximately $345 per square foot. 30 N Belgian Rd is a home located in Essex County with nearby schools including Danvers High School, St. Mary of the Annunciation School, and St. John's Prep.
Ownership History
Date
Name
Owned For
Owner Type
Purchase Details
Closed on
May 30, 2025
Sold by
Specialty Mgmt Svcs Lp
Bought by
Capi Asset Mgmt & Mainten
Current Estimated Value
Purchase Details
Closed on
Dec 1, 1997
Sold by
Training Research Impl
Bought by
Specialty Mgmt Svcs Lp
Purchase Details
Closed on
Mar 16, 1995
Sold by
Fhlmc
Bought by
Training Research Impl
Home Financials for this Owner
Home Financials are based on the most recent Mortgage that was taken out on this home.
Original Mortgage
$217,000
Interest Rate
8.89%
Mortgage Type
Purchase Money Mortgage
Purchase Details
Closed on
Aug 31, 1994
Sold by
Wilson Wayne E
Bought by
Fhlmc
Purchase Details
Closed on
Mar 11, 1987
Sold by
Chen Benjamin F
Bought by
Wilson Wayne E
Create a Home Valuation Report for This Property
The Home Valuation Report is an in-depth analysis detailing your home's value as well as a comparison with similar homes in the area
Home Values in the Area
Average Home Value in this Area
Purchase History
| Date | Buyer | Sale Price | Title Company |
|---|---|---|---|
| Capi Asset Mgmt & Mainten | -- | None Available | |
| Capi Asset Mgmt & Mainten | -- | None Available | |
| Capi Asset Mgmt & Mainten | -- | None Available | |
| Specialty Mgmt Svcs Lp | $215,996 | -- | |
| Specialty Mgmt Svcs Lp | $215,996 | -- | |
| Training Research Impl | $135,000 | -- | |
| Training Research Impl | $135,000 | -- | |
| Fhlmc | $150,000 | -- | |
| Fhlmc | $150,000 | -- | |
| Wilson Wayne E | $180,500 | -- |
Source: Public Records
Mortgage History
| Date | Status | Borrower | Loan Amount |
|---|---|---|---|
| Previous Owner | Wilson Wayne E | $505,000 | |
| Previous Owner | Wilson Wayne E | $217,000 |
Source: Public Records
Tax History
| Year | Tax Paid | Tax Assessment Tax Assessment Total Assessment is a certain percentage of the fair market value that is determined by local assessors to be the total taxable value of land and additions on the property. | Land | Improvement |
|---|---|---|---|---|
| 2025 | $6,568 | $597,600 | $348,800 | $248,800 |
| 2024 | $6,580 | $592,300 | $348,800 | $243,500 |
| 2023 | $6,303 | $536,400 | $317,000 | $219,400 |
| 2022 | $6,158 | $486,400 | $287,600 | $198,800 |
| 2021 | $5,859 | $438,900 | $272,500 | $166,400 |
| 2020 | $5,690 | $435,700 | $269,300 | $166,400 |
| 2019 | $5,461 | $411,200 | $244,800 | $166,400 |
| 2018 | $5,293 | $390,900 | $242,400 | $148,500 |
| 2017 | $5,080 | $358,000 | $211,800 | $146,200 |
| 2016 | $4,841 | $340,900 | $202,000 | $138,900 |
| 2015 | $4,606 | $308,900 | $183,600 | $125,300 |
Source: Public Records
Map
Nearby Homes
- 42 Coolidge Rd
- 35 Locust St Unit 3
- 20 Central Ave
- 4 Butler Ave
- 12 Central Ave Unit 1
- 12 Exeter St
- 38 High St Unit 4
- 35 High St Unit 3D
- 7 Riverbank Ave Unit 7
- 7 Riverbank Ave
- 11 Riverside Ave Unit 111
- 35 Bayview Terrace Unit 7
- 6 Bartlett Rd
- 14 Williams St Unit C17
- 198 Conant St
- 6 Colby Rd
- 6 Laurine Rd
- 147 High St
- 108 Abington Rd Unit 108
- 63 Adams St
- 32 N Belgian Rd
- 28 N Belgian Rd
- 29 N Shetland Rd
- 27 N Shetland Rd
- 34 N Belgian Rd
- 26 N Belgian Rd
- 31 N Shetland Rd
- 25 N Shetland Rd
- 29 N Belgian Rd
- 27 N Belgian Rd
- 31 N Belgian Rd
- 36 N Belgian Rd
- 25 N Belgian Rd
- 24 N Belgian Rd
- 23 N Belgian Rd
- 23 N Shetland Rd
- 33 N Shetland Rd
- 33 N Belgian Rd
- 38 N Belgian Rd
- 35 Belgian (North) Rd