30 N Brae Ct Tenafly, NJ 07670
Estimated Value: $1,845,028 - $2,264,000
5
Beds
4
Baths
3,129
Sq Ft
$646/Sq Ft
Est. Value
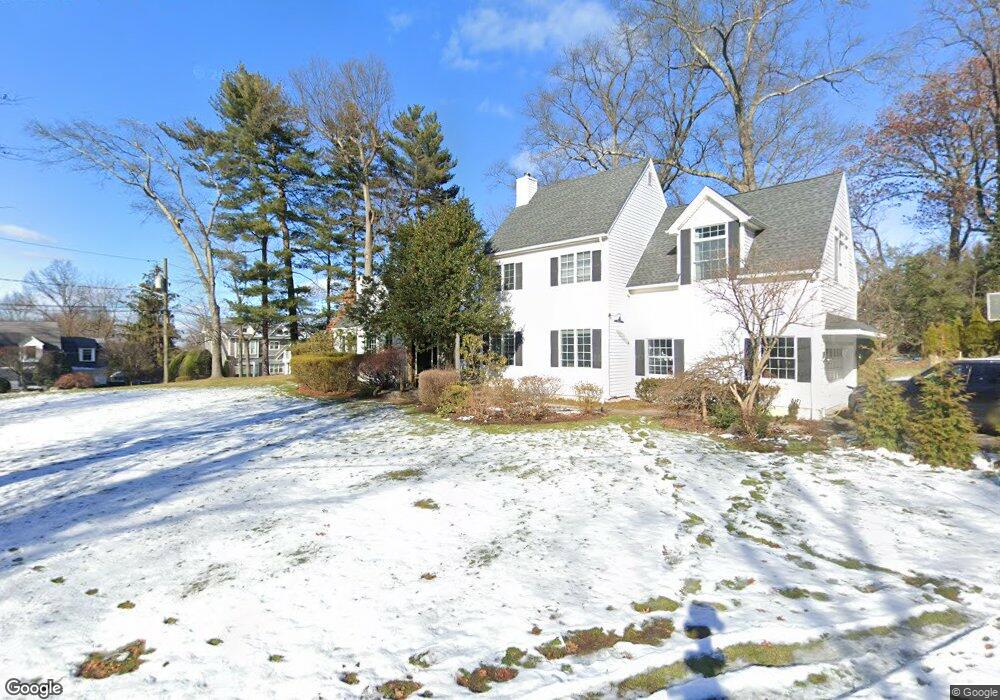
About This Home
This home is located at 30 N Brae Ct, Tenafly, NJ 07670 and is currently estimated at $2,021,507, approximately $646 per square foot. 30 N Brae Ct is a home located in Bergen County with nearby schools including Tenafly Middle School, Tenafly High School, and Spring School.
Ownership History
Date
Name
Owned For
Owner Type
Purchase Details
Closed on
Jan 22, 2019
Sold by
Devillers Claude H
Bought by
Kreilman Bernard
Current Estimated Value
Home Financials for this Owner
Home Financials are based on the most recent Mortgage that was taken out on this home.
Original Mortgage
$455,000
Outstanding Balance
$399,221
Interest Rate
4.5%
Mortgage Type
New Conventional
Estimated Equity
$1,622,286
Purchase Details
Closed on
Nov 4, 2008
Sold by
Devillers Claude H and Devillers Carla E
Bought by
Devilers Claude H
Purchase Details
Closed on
Mar 10, 2000
Sold by
Baker Robert and Baker Robin
Bought by
Devillers Claude H and Devillers Carla E
Home Financials for this Owner
Home Financials are based on the most recent Mortgage that was taken out on this home.
Original Mortgage
$900,000
Interest Rate
7.62%
Create a Home Valuation Report for This Property
The Home Valuation Report is an in-depth analysis detailing your home's value as well as a comparison with similar homes in the area
Home Values in the Area
Average Home Value in this Area
Purchase History
| Date | Buyer | Sale Price | Title Company |
|---|---|---|---|
| Kreilman Bernard | $1,200,000 | -- | |
| Devilers Claude H | -- | -- | |
| Devillers Claude H | $1,125,000 | First American Title Ins Co |
Source: Public Records
Mortgage History
| Date | Status | Borrower | Loan Amount |
|---|---|---|---|
| Open | Kreilman Bernard | $455,000 | |
| Previous Owner | Devillers Claude H | $900,000 |
Source: Public Records
Tax History Compared to Growth
Tax History
| Year | Tax Paid | Tax Assessment Tax Assessment Total Assessment is a certain percentage of the fair market value that is determined by local assessors to be the total taxable value of land and additions on the property. | Land | Improvement |
|---|---|---|---|---|
| 2025 | $29,725 | $1,046,300 | $841,300 | $205,000 |
| 2024 | $29,003 | $1,046,300 | $841,300 | $205,000 |
| 2023 | $28,302 | $1,046,300 | $841,300 | $205,000 |
| 2022 | $28,302 | $1,046,300 | $841,300 | $205,000 |
| 2021 | $27,800 | $1,046,300 | $841,300 | $205,000 |
| 2020 | $27,392 | $1,046,300 | $841,300 | $205,000 |
| 2019 | $31,587 | $1,228,100 | $841,300 | $386,800 |
| 2018 | $31,096 | $1,228,100 | $841,300 | $386,800 |
| 2017 | $30,985 | $1,228,100 | $841,300 | $386,800 |
| 2016 | $30,371 | $1,228,100 | $841,300 | $386,800 |
| 2015 | $29,695 | $1,228,100 | $841,300 | $386,800 |
| 2014 | $29,143 | $1,228,100 | $841,300 | $386,800 |
Source: Public Records
Map
Nearby Homes