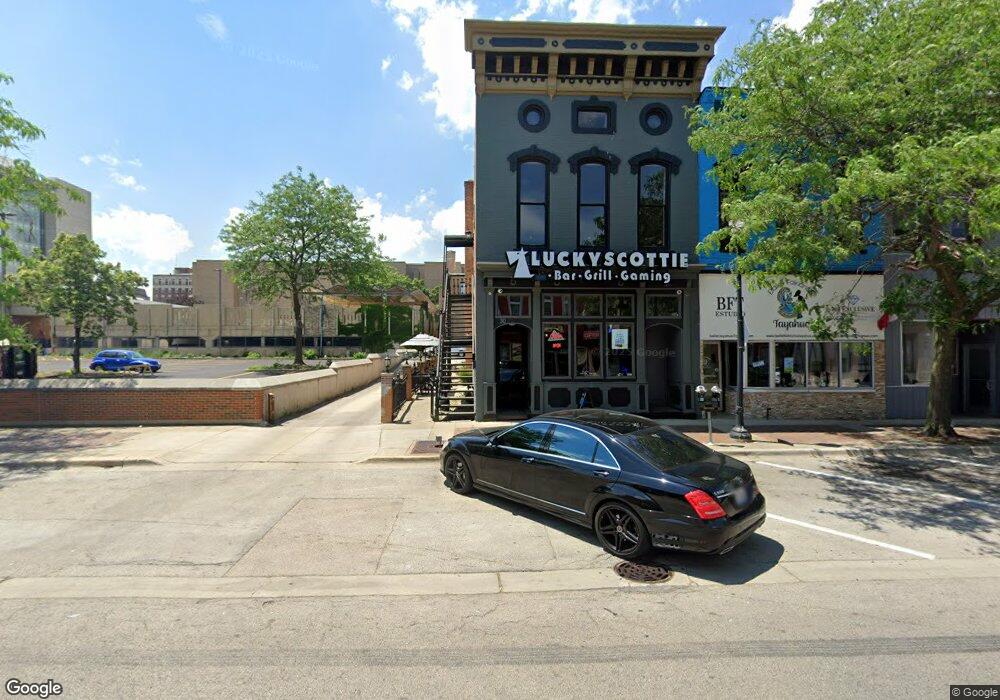
30 N Genesee St Waukegan, IL 60085
Downtown Waukegan NeighborhoodEstimated Value: $546,185
--
Bed
--
Bath
1,586
Sq Ft
$344/Sq Ft
Est. Value
About This Home
This home is located at 30 N Genesee St, Waukegan, IL 60085 and is currently estimated at $546,185, approximately $344 per square foot. 30 N Genesee St is a home located in Lake County with nearby schools including Miguel Juarez Middle School, Waukegan High School, and Most Blessed Trinity Academy.
Ownership History
Date
Name
Owned For
Owner Type
Purchase Details
Closed on
Nov 8, 2023
Sold by
Smart Innovative Group Inc
Bought by
Scottie Group Llc
Current Estimated Value
Home Financials for this Owner
Home Financials are based on the most recent Mortgage that was taken out on this home.
Original Mortgage
$328,500
Outstanding Balance
$322,558
Interest Rate
7.31%
Mortgage Type
Credit Line Revolving
Estimated Equity
$223,627
Purchase Details
Closed on
Feb 6, 2019
Sold by
Forus Enterprises Inc
Bought by
Smart Innovative Group Inc
Purchase Details
Closed on
Jan 27, 2018
Sold by
Jannis Properties Llc
Bought by
Forus Enterprises Inc
Purchase Details
Closed on
Apr 10, 2007
Sold by
Woloshyn Nancy
Bought by
Jannis Properties Llc
Purchase Details
Closed on
Dec 28, 2006
Sold by
James Designs & Construction Inc
Bought by
Woloshyn Nancy
Purchase Details
Closed on
Sep 1, 2004
Sold by
Midwest Bank
Bought by
City Of Waukegan
Purchase Details
Closed on
Jul 29, 2003
Sold by
Potter John E
Bought by
James Designs & Construction Inc
Home Financials for this Owner
Home Financials are based on the most recent Mortgage that was taken out on this home.
Original Mortgage
$172,500
Interest Rate
6%
Mortgage Type
Commercial
Purchase Details
Closed on
May 2, 2003
Sold by
Temple Samuel D
Bought by
Potter John E
Home Financials for this Owner
Home Financials are based on the most recent Mortgage that was taken out on this home.
Original Mortgage
$115,000
Interest Rate
5.5%
Mortgage Type
Commercial
Purchase Details
Closed on
Nov 20, 2002
Sold by
North Star Trust Company
Bought by
Temple Samuel D
Purchase Details
Closed on
Sep 27, 1995
Sold by
Temple Samuel D
Bought by
Bank Of Northern Illinois Na
Create a Home Valuation Report for This Property
The Home Valuation Report is an in-depth analysis detailing your home's value as well as a comparison with similar homes in the area
Home Values in the Area
Average Home Value in this Area
Purchase History
| Date | Buyer | Sale Price | Title Company |
|---|---|---|---|
| Scottie Group Llc | $450,000 | Chicago Title | |
| Smart Innovative Group Inc | $160,000 | Attorney | |
| Forus Enterprises Inc | $140,000 | Chicago Title | |
| Jannis Properties Llc | -- | Chicago Title | |
| Jannis Properties Llc | -- | None Available | |
| Woloshyn Nancy | -- | None Available | |
| City Of Waukegan | -- | -- | |
| James Designs & Construction Inc | $172,500 | -- | |
| Potter John E | $85,000 | -- | |
| Temple Samuel D | -- | -- | |
| Bank Of Northern Illinois Na | -- | -- |
Source: Public Records
Mortgage History
| Date | Status | Borrower | Loan Amount |
|---|---|---|---|
| Open | Scottie Group Llc | $328,500 | |
| Previous Owner | James Designs & Construction Inc | $172,500 | |
| Previous Owner | Potter John E | $115,000 |
Source: Public Records
Tax History Compared to Growth
Tax History
| Year | Tax Paid | Tax Assessment Tax Assessment Total Assessment is a certain percentage of the fair market value that is determined by local assessors to be the total taxable value of land and additions on the property. | Land | Improvement |
|---|---|---|---|---|
| 2024 | $5,129 | $56,891 | $4,154 | $52,737 |
| 2023 | $5,129 | $54,396 | $3,972 | $50,424 |
| 2022 | $4,977 | $50,908 | $3,783 | $47,125 |
| 2021 | $5,261 | $50,464 | $3,750 | $46,714 |
| 2020 | $5,363 | $47,014 | $3,494 | $43,520 |
| 2019 | $5,363 | $43,081 | $3,202 | $39,879 |
| 2018 | $4,332 | $42,487 | $3,158 | $39,329 |
| 2017 | $3,026 | $21,270 | $2,794 | $18,476 |
| 2016 | $5,048 | $35,537 | $2,428 | $33,109 |
| 2015 | $4,016 | $23,776 | $2,173 | $21,603 |
| 2014 | $5,449 | $32,209 | $2,201 | $30,008 |
| 2012 | $6,273 | $36,757 | $2,385 | $34,372 |
Source: Public Records
Map
Nearby Homes
- 222 Grand Ave
- 557 W Water St
- 613 Washington St
- 28 N Saint James St
- 610 Bluff St
- 215 S Park Ave
- 502 Belvidere Rd
- 452 North Ave
- 613 Clarke Ave
- 611 N Genesee St
- 305 Besley Place
- 304 Powell Ave
- 325 4th St
- 428 N Poplar St
- 408 Besley Place
- 23 N Jackson St
- 511 Chestnut St
- 547 S Martin Luther King Junior Ave
- 522 N Poplar St
- 723 N County St
- 32 N Genesee St
- 36 N Genesee St
- 38 N Genesee St
- 29 N Genesee St
- 31 N Genesee St
- 33 N County St
- 17 N Genesee St
- 11 N Genesee St Unit 200
- 11 N Genesee St Unit 300
- 11 N Genesee St Unit 400
- 111 N County St
- 216 W Madison St
- 218 Washington St
- 126 W Madison St Unit 2
- 122 W Madison St
- 224 Washington St
- 114 N Genesee St Unit 114
- 116 N Genesee St Unit 1
- 50 N Sheridan Rd Unit 58
- 50 N Sheridan Rd Unit 64