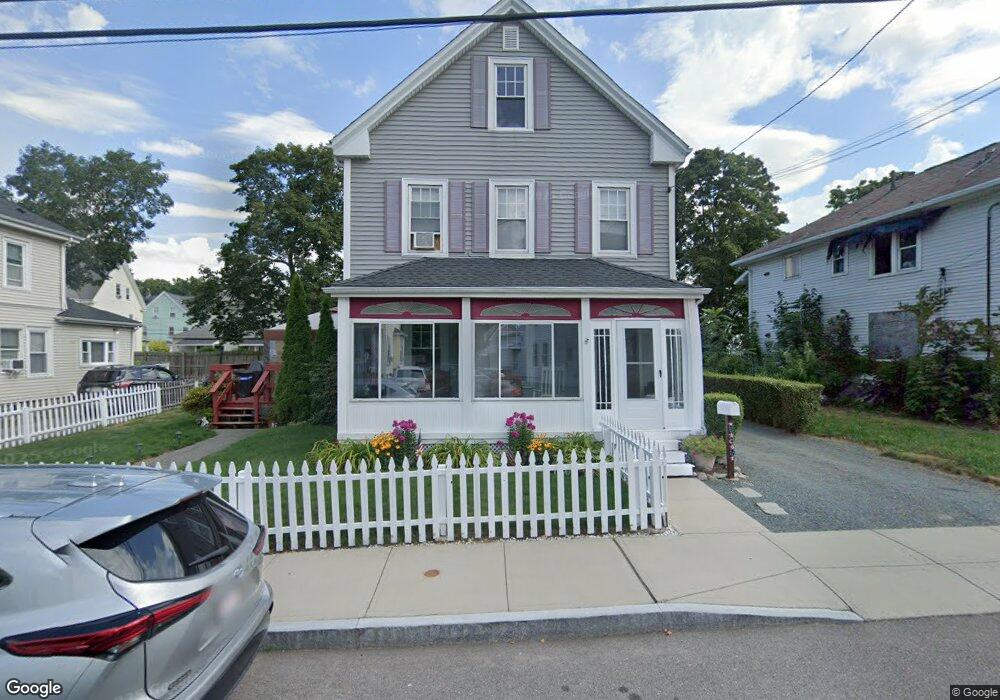
30 N Payne St Quincy, MA 02169
South Quincy NeighborhoodEstimated Value: $720,000 - $771,000
4
Beds
1
Bath
1,837
Sq Ft
$406/Sq Ft
Est. Value
About This Home
This home is located at 30 N Payne St, Quincy, MA 02169 and is currently estimated at $746,341, approximately $406 per square foot. 30 N Payne St is a home located in Norfolk County with nearby schools including Lincoln-Hancock Community School, South West Middle School, and Quincy High School.
Ownership History
Date
Name
Owned For
Owner Type
Purchase Details
Closed on
Feb 7, 2001
Sold by
Reynolds Edward J and Reynolds Lydia V
Bought by
Reynolds Sandra
Current Estimated Value
Home Financials for this Owner
Home Financials are based on the most recent Mortgage that was taken out on this home.
Original Mortgage
$88,000
Interest Rate
7.13%
Mortgage Type
Purchase Money Mortgage
Create a Home Valuation Report for This Property
The Home Valuation Report is an in-depth analysis detailing your home's value as well as a comparison with similar homes in the area
Home Values in the Area
Average Home Value in this Area
Purchase History
| Date | Buyer | Sale Price | Title Company |
|---|---|---|---|
| Reynolds Sandra | $110,000 | -- |
Source: Public Records
Mortgage History
| Date | Status | Borrower | Loan Amount |
|---|---|---|---|
| Open | Reynolds Sandra | $185,000 | |
| Closed | Reynolds Sandra | $88,000 |
Source: Public Records
Tax History Compared to Growth
Tax History
| Year | Tax Paid | Tax Assessment Tax Assessment Total Assessment is a certain percentage of the fair market value that is determined by local assessors to be the total taxable value of land and additions on the property. | Land | Improvement |
|---|---|---|---|---|
| 2025 | $7,298 | $633,000 | $271,200 | $361,800 |
| 2024 | $6,832 | $606,200 | $258,300 | $347,900 |
| 2023 | $6,281 | $564,300 | $234,800 | $329,500 |
| 2022 | $6,369 | $531,600 | $195,700 | $335,900 |
| 2021 | $5,787 | $476,700 | $195,700 | $281,000 |
| 2020 | $5,930 | $477,100 | $195,700 | $281,400 |
| 2019 | $5,784 | $460,900 | $184,600 | $276,300 |
| 2018 | $5,513 | $413,300 | $171,000 | $242,300 |
| 2017 | $5,484 | $387,000 | $162,800 | $224,200 |
| 2016 | $4,996 | $347,900 | $141,500 | $206,400 |
| 2015 | $4,818 | $330,000 | $141,500 | $188,500 |
| 2014 | $4,599 | $309,500 | $141,500 | $168,000 |
Source: Public Records
Map
Nearby Homes
- 5 Pearl St
- 166 Phipps St
- 83 Madison Ave
- 155 Kendrick Ave Unit T7
- 8 Jackson St Unit B2
- 57 Summer St
- 72 Federal Ave
- 33 Brook Rd
- 165 Granite St
- 94 Brook Rd Unit 3
- 18 Cliveden St Unit 201W
- 2 Cliveden St Unit 601E
- 34 South St Unit 202
- 293 Whitwell St
- 73 Scotch Pond Place
- 36 Bigelow St
- 215 Thomas Burgin Pkwy Unit 35
- 5 Main St
- 123 Elm St Unit D-8
- 10 Hughes St
- 24 N Payne St
- 32 N Payne St
- 32-34 N Payne St
- 43 Payne St
- 39 Payne St
- 49 Payne St
- 38 N Payne St
- 25 N Payne St
- 29 N Payne St
- 18 N Payne St
- 19 N Payne St
- 35 N Payne St
- 35 N Payne St Unit 35
- 35 N Payne St Unit 2
- 35 N Payne St Unit 1
- 35 N Payne St Unit 3
- 33 Payne St Unit 2
- 33 Payne St
- 33 Payne St Unit 1
- 35-37 N Payne St