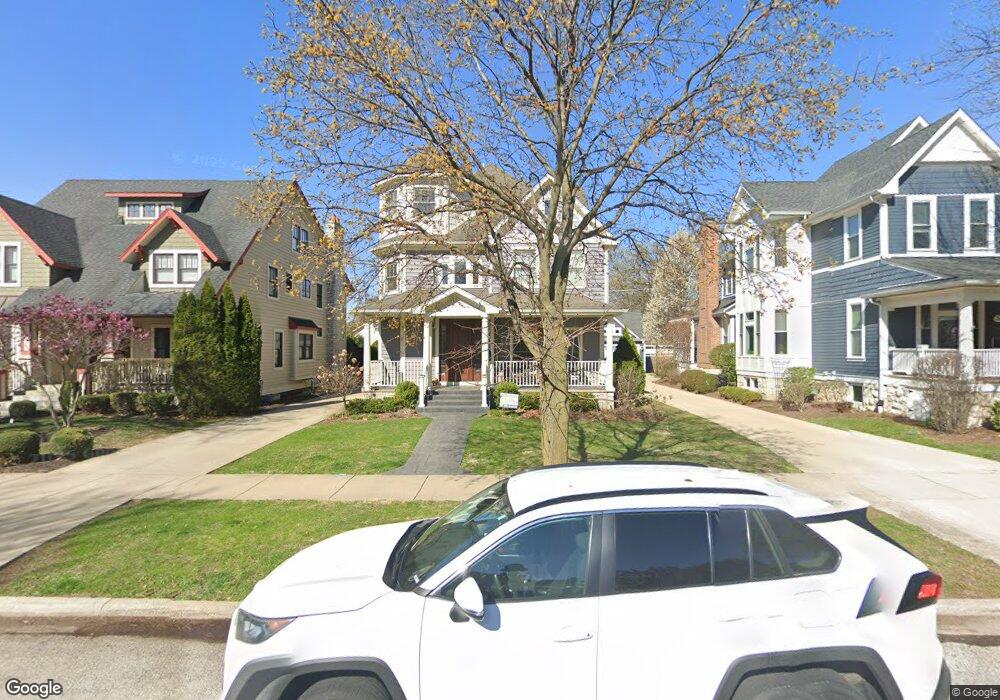
30 N Spring Ave La Grange, IL 60525
Estimated Value: $1,288,000 - $1,677,000
5
Beds
5
Baths
4,000
Sq Ft
$387/Sq Ft
Est. Value
About This Home
This home is located at 30 N Spring Ave, La Grange, IL 60525 and is currently estimated at $1,547,606, approximately $386 per square foot. 30 N Spring Ave is a home located in Cook County with nearby schools including Ogden Ave Elementary School, Park Junior High School, and Lyons Township High School.
Ownership History
Date
Name
Owned For
Owner Type
Purchase Details
Closed on
Nov 9, 2009
Sold by
Integra Bank National Association
Bought by
Ramana Ravi and Ramana Rebecca
Current Estimated Value
Home Financials for this Owner
Home Financials are based on the most recent Mortgage that was taken out on this home.
Original Mortgage
$680,000
Outstanding Balance
$441,052
Interest Rate
4.87%
Mortgage Type
New Conventional
Estimated Equity
$1,106,554
Purchase Details
Closed on
Jul 1, 2009
Sold by
Berane Contracting Group Inc
Bought by
Integra Bank National Association
Purchase Details
Closed on
Aug 1, 2003
Sold by
Revell Curtis A and Revell Darlene A
Bought by
Berane Contracting Group Inc
Home Financials for this Owner
Home Financials are based on the most recent Mortgage that was taken out on this home.
Original Mortgage
$238,400
Interest Rate
4.5%
Mortgage Type
Unknown
Create a Home Valuation Report for This Property
The Home Valuation Report is an in-depth analysis detailing your home's value as well as a comparison with similar homes in the area
Home Values in the Area
Average Home Value in this Area
Purchase History
| Date | Buyer | Sale Price | Title Company |
|---|---|---|---|
| Ramana Ravi | $850,000 | Chicago Title Insurance Co | |
| Integra Bank National Association | -- | None Available | |
| Berane Contracting Group Inc | $295,000 | Multiple |
Source: Public Records
Mortgage History
| Date | Status | Borrower | Loan Amount |
|---|---|---|---|
| Open | Ramana Ravi | $680,000 | |
| Previous Owner | Berane Contracting Group Inc | $238,400 |
Source: Public Records
Tax History Compared to Growth
Tax History
| Year | Tax Paid | Tax Assessment Tax Assessment Total Assessment is a certain percentage of the fair market value that is determined by local assessors to be the total taxable value of land and additions on the property. | Land | Improvement |
|---|---|---|---|---|
| 2024 | $27,456 | $114,000 | $7,480 | $106,520 |
| 2023 | $26,954 | $114,000 | $7,480 | $106,520 |
| 2022 | $26,954 | $95,217 | $6,120 | $89,097 |
| 2021 | $25,916 | $95,216 | $6,120 | $89,096 |
| 2020 | $25,428 | $95,216 | $6,120 | $89,096 |
| 2019 | $28,073 | $105,187 | $5,610 | $99,577 |
| 2018 | $27,537 | $105,187 | $5,610 | $99,577 |
| 2017 | $26,825 | $105,187 | $5,610 | $99,577 |
| 2016 | $23,424 | $82,554 | $4,930 | $77,624 |
| 2015 | $22,820 | $86,052 | $4,930 | $81,122 |
| 2014 | $22,474 | $86,052 | $4,930 | $81,122 |
| 2013 | $21,588 | $84,343 | $4,930 | $79,413 |
Source: Public Records
Map
Nearby Homes
- 33 N Stone Ave
- 709 Bell Ave
- 54 N Ashland Ave
- 17-19 N Brainard Ave
- 27 S Waiola Ave Unit 103
- 518 W Cossitt Ave
- 48 N Park Rd
- 17 S Madison Ave
- 25 S La Grange Rd Unit E
- 28 6th Ave Unit 1D
- 141 N La Grange Rd Unit 504
- 141 N La Grange Rd Unit 905
- 75 E Harris Ave Unit 1E
- 31 Richmond Ave
- 75 6th Ave Unit 102
- 415 N Ashland Ave
- 1105 W Hillgrove Ave Unit 4
- 20 N Edgewood Ave
- 31 Bluff Ave
- 67 Bluff Ave
- 30 N Spring Ave Unit 202
- 34 N Spring Ave
- 28 N Spring Ave
- 38 N Spring Ave
- 20 N Spring Ave
- 40 N Spring Ave
- 33 N Waiola Ave
- 35 N Waiola Ave
- 29 N Waiola Ave
- 14 N Spring Ave
- 41 N Waiola Ave
- 44 N Spring Ave
- 27 N Spring Ave
- 31 N Spring Ave
- 45 N Waiola Ave
- 21 N Spring Ave
- 33 N Spring Ave
- 33 N Spring Ave Unit FRONT
- 427 W Hillgrove Ave
- 46 N Spring Ave