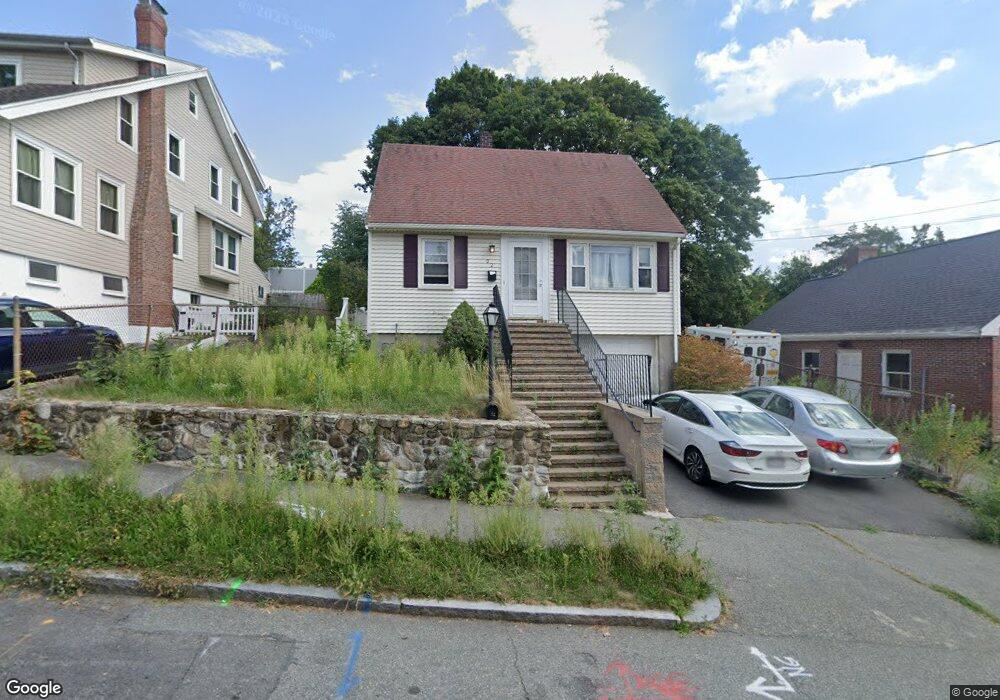
30 Nicholl St Quincy, MA 02169
South Quincy NeighborhoodEstimated Value: $564,000 - $688,000
2
Beds
1
Bath
1,134
Sq Ft
$560/Sq Ft
Est. Value
About This Home
This home is located at 30 Nicholl St, Quincy, MA 02169 and is currently estimated at $634,999, approximately $559 per square foot. 30 Nicholl St is a home located in Norfolk County with nearby schools including Lincoln-Hancock Community School, South West Middle School, and Quincy High School.
Ownership History
Date
Name
Owned For
Owner Type
Purchase Details
Closed on
Nov 30, 2015
Sold by
White Annmarie
Bought by
George-Oneil Christopher
Current Estimated Value
Home Financials for this Owner
Home Financials are based on the most recent Mortgage that was taken out on this home.
Original Mortgage
$202,500
Outstanding Balance
$160,143
Interest Rate
3.87%
Mortgage Type
VA
Estimated Equity
$474,856
Purchase Details
Closed on
Sep 27, 1995
Sold by
Herrick Kathleen M
Bought by
White Annmarie
Home Financials for this Owner
Home Financials are based on the most recent Mortgage that was taken out on this home.
Original Mortgage
$109,350
Interest Rate
7.89%
Mortgage Type
Purchase Money Mortgage
Create a Home Valuation Report for This Property
The Home Valuation Report is an in-depth analysis detailing your home's value as well as a comparison with similar homes in the area
Home Values in the Area
Average Home Value in this Area
Purchase History
| Date | Buyer | Sale Price | Title Company |
|---|---|---|---|
| George-Oneil Christopher | $360,000 | -- | |
| White Annmarie | $121,500 | -- |
Source: Public Records
Mortgage History
| Date | Status | Borrower | Loan Amount |
|---|---|---|---|
| Open | George-Oneil Christopher | $202,500 | |
| Previous Owner | White Annmarie | $109,350 |
Source: Public Records
Tax History Compared to Growth
Tax History
| Year | Tax Paid | Tax Assessment Tax Assessment Total Assessment is a certain percentage of the fair market value that is determined by local assessors to be the total taxable value of land and additions on the property. | Land | Improvement |
|---|---|---|---|---|
| 2025 | $5,682 | $492,800 | $269,600 | $223,200 |
| 2024 | $5,387 | $478,000 | $256,800 | $221,200 |
| 2023 | $4,898 | $440,100 | $233,400 | $206,700 |
| 2022 | $4,654 | $388,500 | $194,500 | $194,000 |
| 2021 | $4,459 | $367,300 | $194,500 | $172,800 |
| 2020 | $4,528 | $364,300 | $194,500 | $169,800 |
| 2019 | $4,184 | $333,400 | $183,500 | $149,900 |
| 2018 | $4,329 | $324,500 | $169,900 | $154,600 |
| 2017 | $4,142 | $292,300 | $161,900 | $130,400 |
| 2016 | $3,777 | $263,000 | $140,700 | $122,300 |
| 2015 | $3,688 | $252,600 | $140,700 | $111,900 |
| 2014 | $3,529 | $237,500 | $140,700 | $96,800 |
Source: Public Records
Map
Nearby Homes
- 10 Hughes St
- 155 Kendrick Ave Unit T7
- 83 Madison Ave
- 102 Conrad St
- 106 Home Park Rd
- 166 Phipps St
- 25 John Paul Cir
- 11 Rogers Cir
- 218 Independence Ave Unit B
- 72 Federal Ave
- 195 Independence Ave Unit 137
- 161 Cedar St
- 54 Elmlawn Rd
- 9 Independence Ave Unit 212
- 23 Bower Rd
- 5 Pearl St
- 8 Jackson St Unit B2
- 57 Summer St
- 39 Morrison Rd
- 200 Falls Blvd Unit G110