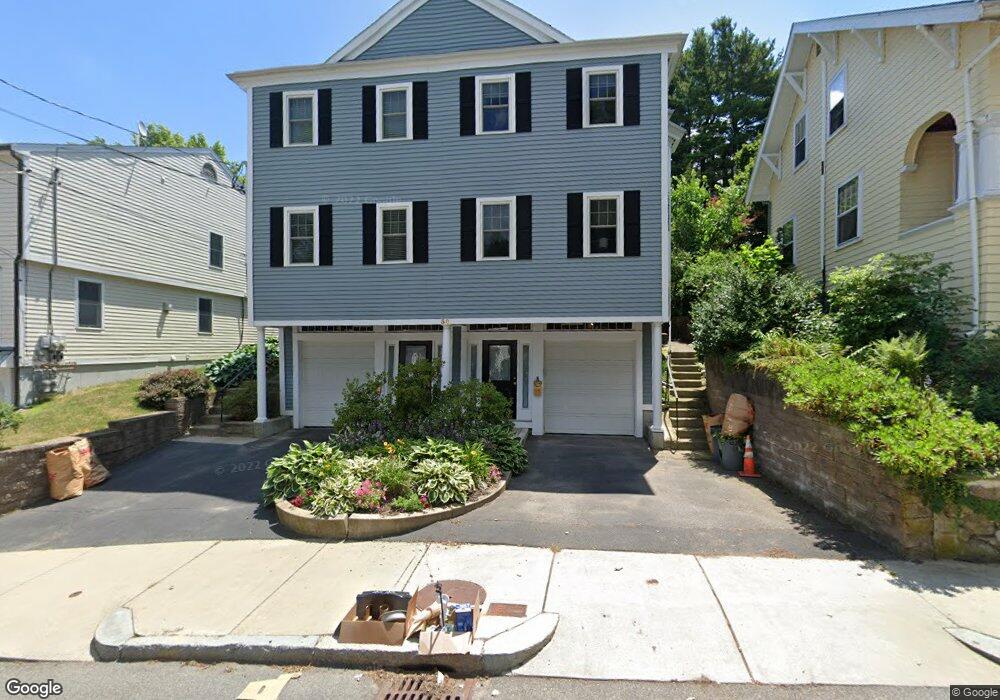
30 Nonantum St Unit 1 Brighton, MA 02135
Brighton NeighborhoodEstimated Value: $849,459 - $977,000
3
Beds
3
Baths
1,630
Sq Ft
$547/Sq Ft
Est. Value
About This Home
This home is located at 30 Nonantum St Unit 1, Brighton, MA 02135 and is currently estimated at $892,365, approximately $547 per square foot. 30 Nonantum St Unit 1 is a home located in Suffolk County with nearby schools including Shaloh House Jewish Day School and St Columbkille Partnership School.
Ownership History
Date
Name
Owned For
Owner Type
Purchase Details
Closed on
Jun 21, 2004
Sold by
Nonantum St Condo 30
Bought by
Burke John P
Current Estimated Value
Home Financials for this Owner
Home Financials are based on the most recent Mortgage that was taken out on this home.
Original Mortgage
$333,700
Outstanding Balance
$164,437
Interest Rate
6.12%
Mortgage Type
Purchase Money Mortgage
Estimated Equity
$727,928
Create a Home Valuation Report for This Property
The Home Valuation Report is an in-depth analysis detailing your home's value as well as a comparison with similar homes in the area
Home Values in the Area
Average Home Value in this Area
Purchase History
| Date | Buyer | Sale Price | Title Company |
|---|---|---|---|
| Burke John P | $477,460 | -- |
Source: Public Records
Mortgage History
| Date | Status | Borrower | Loan Amount |
|---|---|---|---|
| Open | Burke John P | $333,700 |
Source: Public Records
Tax History Compared to Growth
Tax History
| Year | Tax Paid | Tax Assessment Tax Assessment Total Assessment is a certain percentage of the fair market value that is determined by local assessors to be the total taxable value of land and additions on the property. | Land | Improvement |
|---|---|---|---|---|
| 2025 | $8,237 | $711,300 | $0 | $711,300 |
| 2024 | $7,284 | $668,300 | $0 | $668,300 |
| 2023 | $7,178 | $668,300 | $0 | $668,300 |
| 2022 | $6,925 | $636,500 | $0 | $636,500 |
| 2021 | $6,658 | $624,000 | $0 | $624,000 |
| 2020 | $6,777 | $641,800 | $0 | $641,800 |
| 2019 | $6,506 | $617,300 | $0 | $617,300 |
| 2018 | $6,191 | $590,700 | $0 | $590,700 |
| 2017 | $5,793 | $547,000 | $0 | $547,000 |
| 2016 | $5,730 | $520,900 | $0 | $520,900 |
| 2015 | $5,761 | $475,700 | $0 | $475,700 |
| 2014 | $5,435 | $432,000 | $0 | $432,000 |
Source: Public Records
Map
Nearby Homes
- 18 Breck Ave Unit 18
- 427-435 Faneuil St Unit R4
- 8 Tremont Place
- 22 Bigelow St
- 21 Glenley Terrace
- 39 Champney St
- 14 Atkins St
- 99 Tremont St Unit 105
- 99 Tremont St Unit 413
- 365 Faneuil St Unit 2
- 34 Larch St Unit 34
- 32 Larch St Unit 34
- 32-34 Larch St
- 121 Tremont St Unit B1
- 142 Kenrick St Unit 36
- 21 Upcrest Rd
- 69 Presentation Rd
- 116 Lake Shore Rd Unit 4
- 12 Mina Way
- 10 Mina Way
- 30 Nonantum St Unit 2
- 30 Nonantum St Unit 30-2
- 30 Nonantum St Unit 30-1
- 20 Nonantum St Unit B
- 20 Nonantum St Unit A
- 20 Nonantum St Unit 2
- 32 Nonantum St
- 43 Breck Ave
- 18 Nonantum St Unit 2
- 18 Nonantum St Unit 1
- 43 Nonantum St
- 45 Nonantum St
- 45 Nonantum St Unit 2
- 4 N Crescent Circuit
- 4 N Crescent Circuit Unit 1
- 49 Nonantum St
- 49 Nonantum St Unit 2
- 40 Nonantum St
- 45 Breck Ave Unit 47
- 47 Breck Ave Unit 47