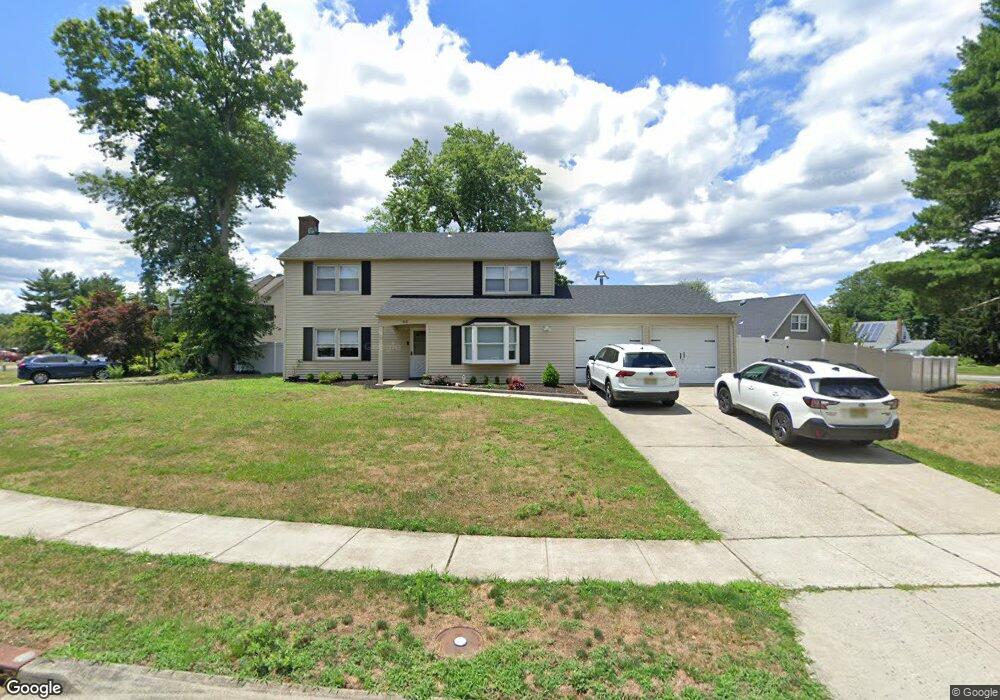
30 North Cir Matawan, NJ 07747
Estimated Value: $632,000 - $705,000
3
Beds
3
Baths
2,022
Sq Ft
$330/Sq Ft
Est. Value
About This Home
This home is located at 30 North Cir, Matawan, NJ 07747 and is currently estimated at $667,949, approximately $330 per square foot. 30 North Cir is a home located in Monmouth County with nearby schools including Matawan Reg High School, St. Joseph Elementary School, and St Benedict School.
Ownership History
Date
Name
Owned For
Owner Type
Purchase Details
Closed on
Jun 6, 2020
Sold by
Westover John
Bought by
Bradfield Christopher J and Lenardo Dana M
Current Estimated Value
Home Financials for this Owner
Home Financials are based on the most recent Mortgage that was taken out on this home.
Original Mortgage
$314,204
Outstanding Balance
$278,518
Interest Rate
3.2%
Mortgage Type
FHA
Estimated Equity
$389,431
Purchase Details
Closed on
Aug 10, 2017
Sold by
Westover John
Bought by
Westover John
Create a Home Valuation Report for This Property
The Home Valuation Report is an in-depth analysis detailing your home's value as well as a comparison with similar homes in the area
Home Values in the Area
Average Home Value in this Area
Purchase History
| Date | Buyer | Sale Price | Title Company |
|---|---|---|---|
| Bradfield Christopher J | $320,000 | East Coast Title Agency | |
| Westover John | -- | None Available |
Source: Public Records
Mortgage History
| Date | Status | Borrower | Loan Amount |
|---|---|---|---|
| Open | Bradfield Christopher J | $314,204 |
Source: Public Records
Tax History
| Year | Tax Paid | Tax Assessment Tax Assessment Total Assessment is a certain percentage of the fair market value that is determined by local assessors to be the total taxable value of land and additions on the property. | Land | Improvement |
|---|---|---|---|---|
| 2025 | $9,632 | $540,600 | $412,600 | $128,000 |
| 2024 | $9,198 | $476,600 | $350,900 | $125,700 |
Source: Public Records
Map
Nearby Homes
- 3 Noble Place
- 13 Cresci Blvd
- 3 Harrison Ave
- 10 Johnson Ave
- 207 Lower Main St
- 154 Lower Main St
- 16 Galway Dr
- 20 Galway Dr
- 55 Lower Main St
- 46 Parkview Dr
- 5 Limerick Place
- 101 Broad St
- 22 Lower Main St
- 68 Main St
- 5 7th St
- 9 Parkview Dr
- 9 Fountain Ave
- 284 Washington St
- 81 Village Green Way
- 259 Matawan Ave
Your Personal Tour Guide
Ask me questions while you tour the home.