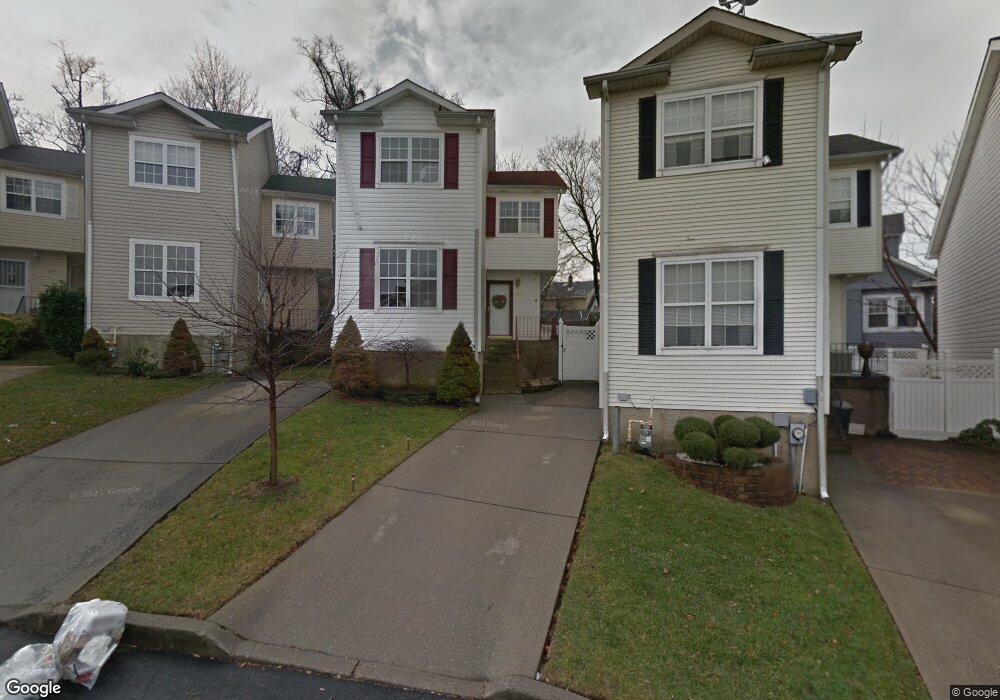
30 Northview Ct Staten Island, NY 10301
New Brighton NeighborhoodEstimated Value: $503,000 - $598,000
3
Beds
2
Baths
1,824
Sq Ft
$303/Sq Ft
Est. Value
About This Home
This home is located at 30 Northview Ct, Staten Island, NY 10301 and is currently estimated at $553,406, approximately $303 per square foot. 30 Northview Ct is a home located in Richmond County with nearby schools including P.S. 31 - William T. Davis, Is 61 William A Morris, and Curtis High School.
Ownership History
Date
Name
Owned For
Owner Type
Purchase Details
Closed on
Sep 26, 2008
Sold by
Colon Ivan and Colon Raquel
Bought by
Monte Debra
Current Estimated Value
Home Financials for this Owner
Home Financials are based on the most recent Mortgage that was taken out on this home.
Original Mortgage
$282,487
Outstanding Balance
$188,837
Interest Rate
6.54%
Mortgage Type
FHA
Estimated Equity
$364,569
Purchase Details
Closed on
Nov 30, 2001
Sold by
Derby Court Homes Inc
Bought by
Colon Ivan and Ramirez Raquel
Create a Home Valuation Report for This Property
The Home Valuation Report is an in-depth analysis detailing your home's value as well as a comparison with similar homes in the area
Home Values in the Area
Average Home Value in this Area
Purchase History
| Date | Buyer | Sale Price | Title Company |
|---|---|---|---|
| Monte Debra | $310,000 | None Available | |
| Colon Ivan | $180,000 | Fidelity National Title Ins |
Source: Public Records
Mortgage History
| Date | Status | Borrower | Loan Amount |
|---|---|---|---|
| Open | Monte Debra | $282,487 |
Source: Public Records
Tax History Compared to Growth
Tax History
| Year | Tax Paid | Tax Assessment Tax Assessment Total Assessment is a certain percentage of the fair market value that is determined by local assessors to be the total taxable value of land and additions on the property. | Land | Improvement |
|---|---|---|---|---|
| 2025 | $4,707 | $27,180 | $4,823 | $22,357 |
| 2024 | $3,326 | $28,800 | $4,294 | $24,506 |
| 2023 | $3,081 | $23,430 | $3,430 | $20,000 |
| 2022 | $2,733 | $28,980 | $4,980 | $24,000 |
| 2021 | $4,349 | $25,620 | $4,980 | $20,640 |
| 2020 | $4,348 | $25,020 | $4,980 | $20,040 |
| 2019 | $4,037 | $25,860 | $4,980 | $20,880 |
| 2018 | $3,683 | $19,525 | $4,823 | $14,702 |
| 2017 | $3,455 | $18,420 | $4,980 | $13,440 |
| 2016 | $3,802 | $20,571 | $4,730 | $15,841 |
| 2015 | $3,369 | $19,407 | $4,770 | $14,637 |
| 2014 | $3,369 | $19,142 | $5,074 | $14,068 |
Source: Public Records
Map
Nearby Homes
- 77 York Ave
- 36 Fillmore St
- 16 Van Buren St
- 24-26 York Ave
- 27 Eadie Place
- 203 York Ave
- 61 York Ave
- 12 York Ave
- 135 Highview Ave
- 52 Park Place
- 93 Taft Ave
- 12 Pauw St
- 75 Taft Ave
- 31 Crescent Ave
- 180 Fillmore St
- 177 W Buchanan St Unit 79
- 63 Cassidy Place
- 138 Hendricks Ave
- 84 Prospect Ave
- 190 W Buchanan St
- 20 Northview Ct
- 28 E Buchanan St
- 50 Northview Ct
- 10 Northview Ct
- 60 Northview Ct
- 30 E Buchanan St
- 53 1/2 Highview Ave
- 70 Northview Ct
- 80 Northview Ct
- 140 Northview Ct
- 57 Highview Ave
- 51 Highview Ave
- 49 Highview Ave
- 53 Highview Ave
- 53 Highview Ave Unit 1/2
- 47 Highview Ave
- 90 Northview Ct
- 130 Northview Ct
- 23 E Buchanan St
- 27 E Buchanan St