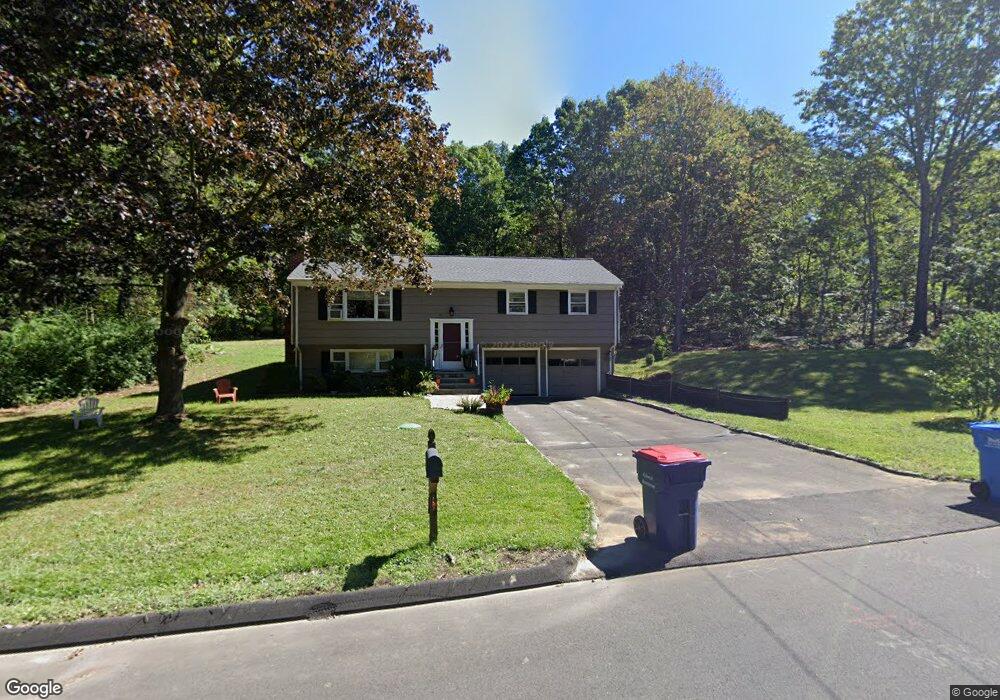
30 Osborn Ln Monroe, CT 06468
Estimated Value: $412,000 - $574,000
3
Beds
3
Baths
1,196
Sq Ft
$418/Sq Ft
Est. Value
About This Home
This home is located at 30 Osborn Ln, Monroe, CT 06468 and is currently estimated at $500,096, approximately $418 per square foot. 30 Osborn Ln is a home located in Fairfield County with nearby schools including Monroe Elementary School, Jockey Hollow Middle School, and Masuk High School.
Ownership History
Date
Name
Owned For
Owner Type
Purchase Details
Closed on
Jul 31, 1992
Sold by
Clericuzio Mario and Arduini Anna
Bought by
Dotoratos James and Dotoratos Shirley
Current Estimated Value
Home Financials for this Owner
Home Financials are based on the most recent Mortgage that was taken out on this home.
Original Mortgage
$133,000
Interest Rate
8.46%
Mortgage Type
Unknown
Purchase Details
Closed on
Jul 1, 1988
Sold by
Ferreira Antonio
Bought by
Clericuzio Mario
Create a Home Valuation Report for This Property
The Home Valuation Report is an in-depth analysis detailing your home's value as well as a comparison with similar homes in the area
Home Values in the Area
Average Home Value in this Area
Purchase History
| Date | Buyer | Sale Price | Title Company |
|---|---|---|---|
| Dotoratos James | $188,000 | -- | |
| Dotoratos James | $188,000 | -- | |
| Clericuzio Mario | $198,500 | -- |
Source: Public Records
Mortgage History
| Date | Status | Borrower | Loan Amount |
|---|---|---|---|
| Closed | Clericuzio Mario | $114,100 | |
| Closed | Clericuzio Mario | $133,000 | |
| Previous Owner | Clericuzio Mario | $137,500 |
Source: Public Records
Tax History
| Year | Tax Paid | Tax Assessment Tax Assessment Total Assessment is a certain percentage of the fair market value that is determined by local assessors to be the total taxable value of land and additions on the property. | Land | Improvement |
|---|---|---|---|---|
| 2025 | $7,650 | $266,840 | $105,140 | $161,700 |
| 2024 | $7,118 | $186,000 | $91,100 | $94,900 |
| 2023 | $6,984 | $186,000 | $91,100 | $94,900 |
| 2022 | $6,856 | $186,000 | $91,100 | $94,900 |
| 2021 | $12,570 | $186,000 | $91,100 | $94,900 |
| 2020 | $6,599 | $186,000 | $91,100 | $94,900 |
| 2019 | $6,059 | $170,300 | $91,100 | $79,200 |
| 2018 | $12,665 | $170,300 | $91,100 | $79,200 |
| 2017 | $6,090 | $170,300 | $91,100 | $79,200 |
| 2016 | $5,961 | $170,300 | $91,100 | $79,200 |
| 2015 | $5,850 | $170,300 | $91,100 | $79,200 |
| 2014 | $6,684 | $215,530 | $115,640 | $99,890 |
Source: Public Records
Map
Nearby Homes
- 40 Walnut St
- 215 Wheeler Rd
- 249 Wheeler Rd
- 115 Wheeler Rd
- 36 Spinning Wheel Rd
- 56 Lazy Brook Rd
- 7 Canterbury Ln
- 67 Hillside Ln
- 128 Barn Hill Rd
- 396 Walnut Tree Hill Rd
- 117 Settlers Farm Rd
- 1536 & 1564 Monroe Turnpike
- 23 Bonita Dr
- 32 Valley View Rd
- 286 Moose Hill Rd
- Lot A Abbey Ln
- 261 Moose Hill Rd
- 2 Winthrop Woods Rd
- 4 Winthrop Woods Rd
- 60 Hawthorne Dr
Your Personal Tour Guide
Ask me questions while you tour the home.