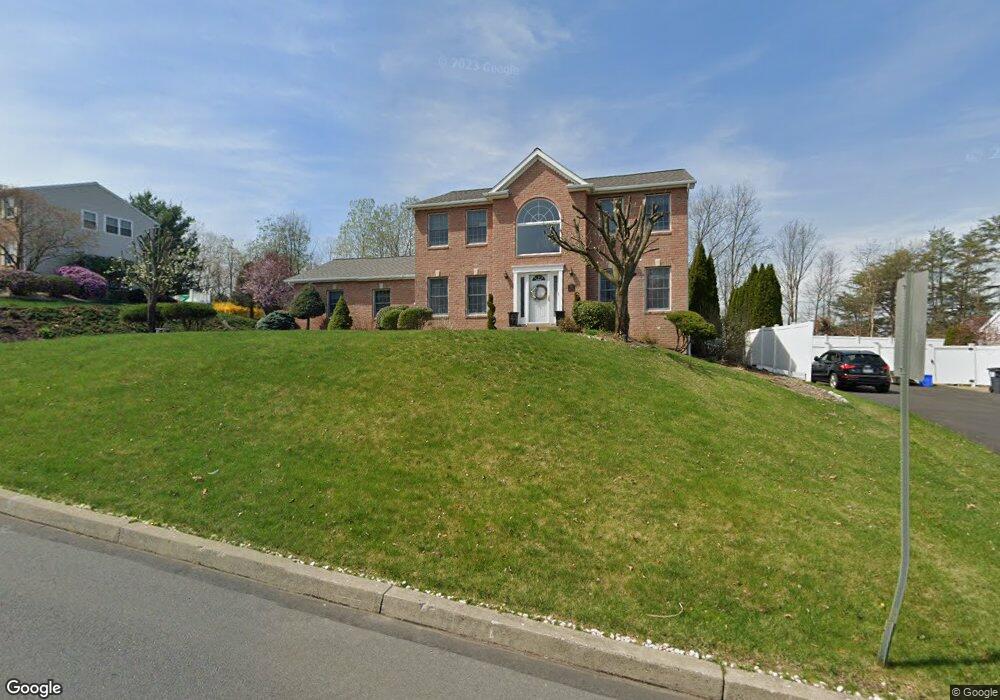
30 Osborne Dr Pittston, PA 18640
Estimated Value: $419,000 - $637,000
4
Beds
4
Baths
3,194
Sq Ft
$154/Sq Ft
Est. Value
About This Home
This home is located at 30 Osborne Dr, Pittston, PA 18640 and is currently estimated at $491,237, approximately $153 per square foot. 30 Osborne Dr is a home located in Luzerne County with nearby schools including Pittston City Intermediate Center, Pittston Area Middle School, and Frederick County Middle School.
Ownership History
Date
Name
Owned For
Owner Type
Purchase Details
Closed on
Jun 27, 2019
Sold by
Novitsky Alan C and Novitsky Jody A
Bought by
Riley Daniel C and Riley Anita R
Current Estimated Value
Home Financials for this Owner
Home Financials are based on the most recent Mortgage that was taken out on this home.
Original Mortgage
$302,000
Outstanding Balance
$265,013
Interest Rate
3.9%
Mortgage Type
New Conventional
Estimated Equity
$226,224
Purchase Details
Closed on
Dec 9, 2016
Sold by
Valenti Stephen J and Valenti Janet M
Bought by
Novitsky Alan C and Novitsky Jody A
Purchase Details
Closed on
Aug 31, 2012
Sold by
Smith Jonathan Carl and Smith Beatrice M
Bought by
Valenti Stephen J and Valenti Janet M
Create a Home Valuation Report for This Property
The Home Valuation Report is an in-depth analysis detailing your home's value as well as a comparison with similar homes in the area
Home Values in the Area
Average Home Value in this Area
Purchase History
| Date | Buyer | Sale Price | Title Company |
|---|---|---|---|
| Riley Daniel C | $377,500 | Abstract Resources Inc | |
| Novitsky Alan C | $367,500 | None Available | |
| Valenti Stephen J | $345,000 | None Available | |
| Valenti Stephen J | $345,000 | None Available |
Source: Public Records
Mortgage History
| Date | Status | Borrower | Loan Amount |
|---|---|---|---|
| Open | Riley Daniel C | $302,000 |
Source: Public Records
Tax History Compared to Growth
Tax History
| Year | Tax Paid | Tax Assessment Tax Assessment Total Assessment is a certain percentage of the fair market value that is determined by local assessors to be the total taxable value of land and additions on the property. | Land | Improvement |
|---|---|---|---|---|
| 2025 | $6,367 | $255,000 | $65,000 | $190,000 |
| 2024 | $6,367 | $255,000 | $65,000 | $190,000 |
| 2023 | $6,240 | $255,000 | $65,000 | $190,000 |
| 2022 | $6,193 | $255,000 | $65,000 | $190,000 |
| 2021 | $6,193 | $255,000 | $65,000 | $190,000 |
| 2020 | $6,050 | $255,000 | $65,000 | $190,000 |
| 2019 | $3,126 | $255,000 | $65,000 | $190,000 |
| 2018 | $5,874 | $255,000 | $65,000 | $190,000 |
| 2017 | $5,757 | $255,000 | $65,000 | $190,000 |
| 2016 | -- | $255,000 | $65,000 | $190,000 |
| 2015 | $4,844 | $255,000 | $65,000 | $190,000 |
| 2014 | $4,844 | $255,000 | $65,000 | $190,000 |
Source: Public Records
Map
Nearby Homes