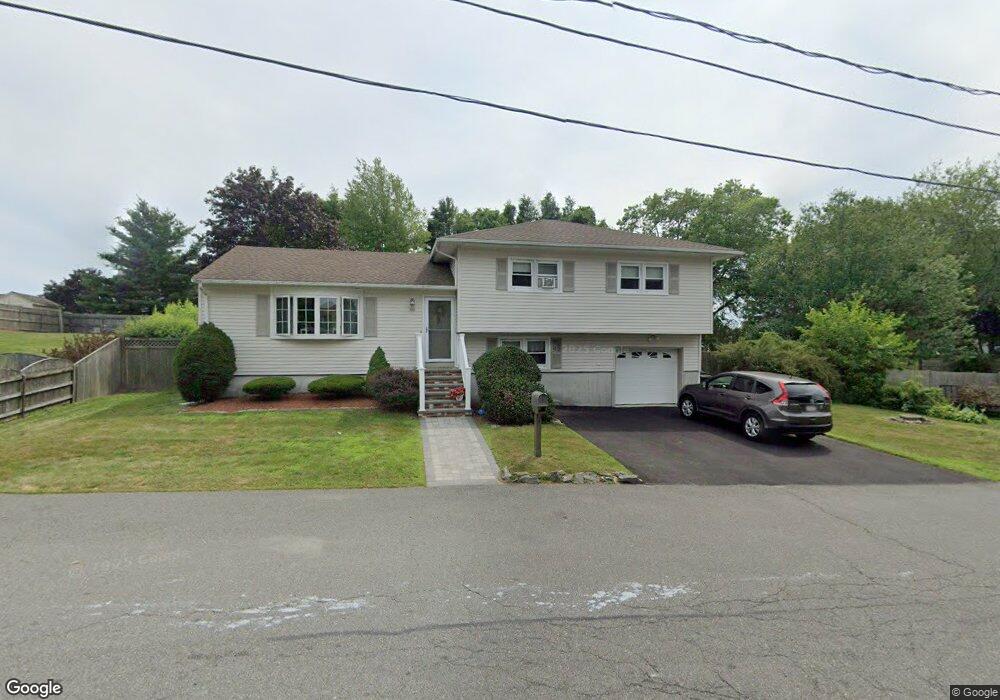
30 Outlook Ave Salem, MA 01970
Witchcraft Heights NeighborhoodEstimated Value: $689,000 - $716,000
3
Beds
2
Baths
1,640
Sq Ft
$427/Sq Ft
Est. Value
About This Home
This home is located at 30 Outlook Ave, Salem, MA 01970 and is currently estimated at $700,842, approximately $427 per square foot. 30 Outlook Ave is a home located in Essex County with nearby schools including Witchcraft Heights Elementary School, Horace Mann Laboratory, and Saltonstall School.
Ownership History
Date
Name
Owned For
Owner Type
Purchase Details
Closed on
Jan 27, 2017
Sold by
Connor Edward R
Bought by
Connor Patricia
Current Estimated Value
Home Financials for this Owner
Home Financials are based on the most recent Mortgage that was taken out on this home.
Original Mortgage
$237,000
Outstanding Balance
$196,006
Interest Rate
4.16%
Mortgage Type
New Conventional
Estimated Equity
$504,836
Purchase Details
Closed on
Mar 31, 2005
Sold by
Mazman Edward G and Mazman Virginia
Bought by
Oconnor Edward R
Create a Home Valuation Report for This Property
The Home Valuation Report is an in-depth analysis detailing your home's value as well as a comparison with similar homes in the area
Home Values in the Area
Average Home Value in this Area
Purchase History
| Date | Buyer | Sale Price | Title Company |
|---|---|---|---|
| Connor Patricia | -- | -- | |
| Oconnor Edward R | $362,500 | -- |
Source: Public Records
Mortgage History
| Date | Status | Borrower | Loan Amount |
|---|---|---|---|
| Open | Connor Patricia | $237,000 | |
| Previous Owner | Oconnor Edward R | $213,000 | |
| Previous Owner | Oconnor Edward R | $219,000 |
Source: Public Records
Tax History Compared to Growth
Tax History
| Year | Tax Paid | Tax Assessment Tax Assessment Total Assessment is a certain percentage of the fair market value that is determined by local assessors to be the total taxable value of land and additions on the property. | Land | Improvement |
|---|---|---|---|---|
| 2025 | $6,923 | $610,500 | $203,700 | $406,800 |
| 2024 | $6,870 | $591,200 | $203,700 | $387,500 |
| 2023 | $6,605 | $528,000 | $186,400 | $341,600 |
| 2022 | $6,225 | $469,800 | $179,500 | $290,300 |
| 2021 | $6,026 | $436,700 | $179,500 | $257,200 |
| 2020 | $5,852 | $405,000 | $169,100 | $235,900 |
| 2019 | $5,723 | $379,000 | $160,900 | $218,100 |
| 2018 | $5,514 | $358,500 | $153,300 | $205,200 |
| 2017 | $5,297 | $334,000 | $145,000 | $189,000 |
| 2016 | $4,963 | $316,700 | $127,700 | $189,000 |
| 2015 | $4,736 | $288,600 | $117,400 | $171,200 |
Source: Public Records
Map
Nearby Homes
- 25 Outlook Ave
- 159 Marlborough Rd
- 11 Osborne Hill Dr
- 176 Marlborough Rd
- 46 Sutton St
- 21 Chanelle Cir
- 36 Valley St
- 38 Valley St
- 13 State St
- 9 Sutton St
- 2 Osborne St
- 57 Ord St
- 35 First St Unit A
- 36 Summit St
- 119 Highland Ave
- 15 Wall St
- 22 Celestial Way
- 32 Whalers Ln Unit C
- 84 Cavendish Cir
- 63 Cavendish Cir