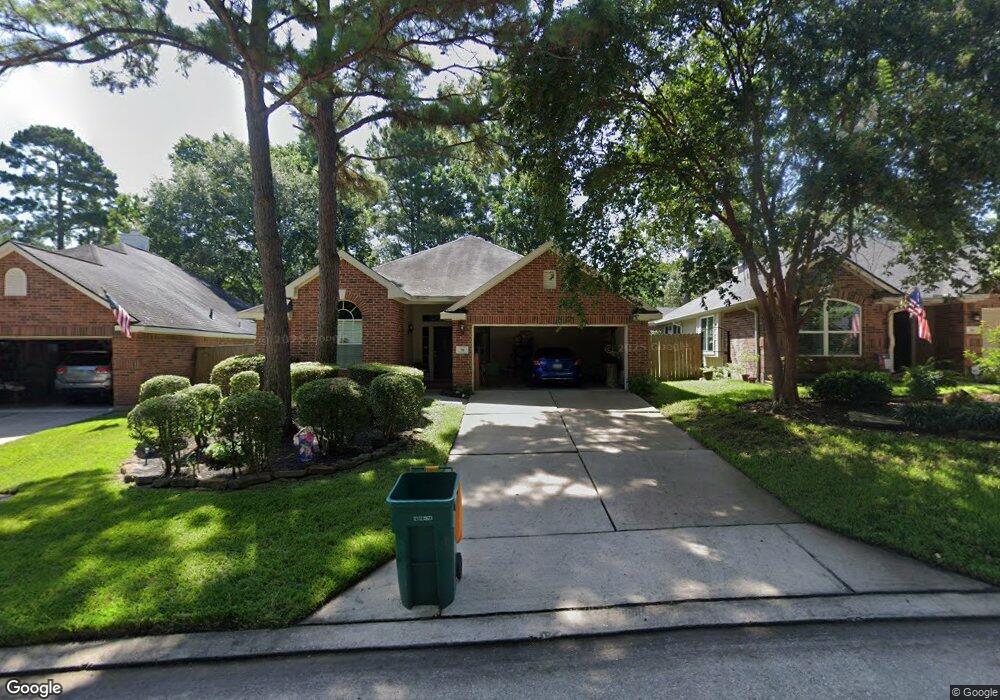
30 Paddock Pines Place Spring, TX 77382
Alden Bridge NeighborhoodEstimated Value: $318,199 - $382,000
2
Beds
2
Baths
1,623
Sq Ft
$225/Sq Ft
Est. Value
About This Home
This home is located at 30 Paddock Pines Place, Spring, TX 77382 and is currently estimated at $365,550, approximately $225 per square foot. 30 Paddock Pines Place is a home located in Montgomery County with nearby schools including Buckalew Elementary School, Mitchell Intermediate School, and McCullough Junior High School.
Ownership History
Date
Name
Owned For
Owner Type
Purchase Details
Closed on
Jan 10, 2017
Sold by
Cooper Shanee and Cooper Noelle H
Bought by
Payne Christine Aleta
Current Estimated Value
Home Financials for this Owner
Home Financials are based on the most recent Mortgage that was taken out on this home.
Original Mortgage
$60,000
Outstanding Balance
$49,502
Interest Rate
4.16%
Mortgage Type
New Conventional
Estimated Equity
$316,048
Purchase Details
Closed on
Sep 26, 2001
Sold by
Mccall Douglas L
Bought by
Cooper Shane E and Cooper Noelle H
Home Financials for this Owner
Home Financials are based on the most recent Mortgage that was taken out on this home.
Original Mortgage
$123,576
Interest Rate
6.88%
Mortgage Type
FHA
Purchase Details
Closed on
Feb 23, 1998
Sold by
Woodlands Land Dev Lp
Bought by
Payne Christine Aleta
Create a Home Valuation Report for This Property
The Home Valuation Report is an in-depth analysis detailing your home's value as well as a comparison with similar homes in the area
Home Values in the Area
Average Home Value in this Area
Purchase History
| Date | Buyer | Sale Price | Title Company |
|---|---|---|---|
| Payne Christine Aleta | -- | First American Title | |
| Cooper Shane E | -- | Chicago Title | |
| Payne Christine Aleta | -- | -- |
Source: Public Records
Mortgage History
| Date | Status | Borrower | Loan Amount |
|---|---|---|---|
| Open | Payne Christine Aleta | $60,000 | |
| Previous Owner | Cooper Shane E | $123,576 |
Source: Public Records
Tax History
| Year | Tax Paid | Tax Assessment Tax Assessment Total Assessment is a certain percentage of the fair market value that is determined by local assessors to be the total taxable value of land and additions on the property. | Land | Improvement |
|---|---|---|---|---|
| 2025 | $2,155 | $328,111 | $50,000 | $278,111 |
| 2024 | $2,142 | $308,891 | -- | -- |
| 2023 | $2,142 | $280,810 | $50,000 | $275,660 |
| 2022 | $5,174 | $255,280 | $50,000 | $0 |
| 2021 | $5,062 | $232,070 | $24,090 | $207,980 |
| 2020 | $5,213 | $225,360 | $24,090 | $201,270 |
| 2019 | $4,964 | $207,990 | $24,090 | $183,900 |
| 2018 | $3,506 | $197,120 | $24,090 | $173,030 |
| 2017 | $4,854 | $200,920 | $24,090 | $176,830 |
| 2016 | $4,659 | $192,830 | $24,090 | $203,520 |
| 2015 | $3,679 | $175,300 | $24,090 | $170,160 |
| 2014 | $3,679 | $159,360 | $24,090 | $170,160 |
Source: Public Records
Map
Nearby Homes
- 123 N Acacia Park Cir
- 119 N Acacia Park Cir
- 19 Pipers Meadow St
- 158 Lattice Gate St
- 42 W Gaslight Place
- 6 Coachman Ridge Place
- 205 Friesian Ln
- 19 E New Avery Place
- 42 Camber Pine Place
- 209 Fox Trotter
- 130 Lattice Gate St
- 55 W Pipers Green St
- 132 Chestnut Bay
- 27 E Bellmeade Place
- 43 N Belfair Place
- 43 Crocus Petal St
- 230 S Walden Elms Cir
- 131 N Villa Oaks Dr
- 85 Summer Lark Place
- 39 Butterfly Branch Place
- 26 Paddock Pines Place
- 34 Paddock Pines Place
- 22 Paddock Pines Place
- 38 Paddock Pines Place
- 23 Mulberry Glen Place
- 19 Mulberry Glen Place
- 27 Mulberry Glen Place
- 15 Mulberry Glen Place
- 18 Paddock Pines Place
- 31 Mulberry Glen Place
- 31 Paddock Pines Place
- 11 Mulberry Glen Place
- 27 Paddock Pines Place
- 39 Paddock Pines Place
- 14 Paddock Pines Place
- 23 Paddock Pines Place
- 9 Mulberry Glen Place
- 19 Paddock Pines Place
- 10 Paddock Pines Place
- 7 Mulberry Glen Place
Your Personal Tour Guide
Ask me questions while you tour the home.