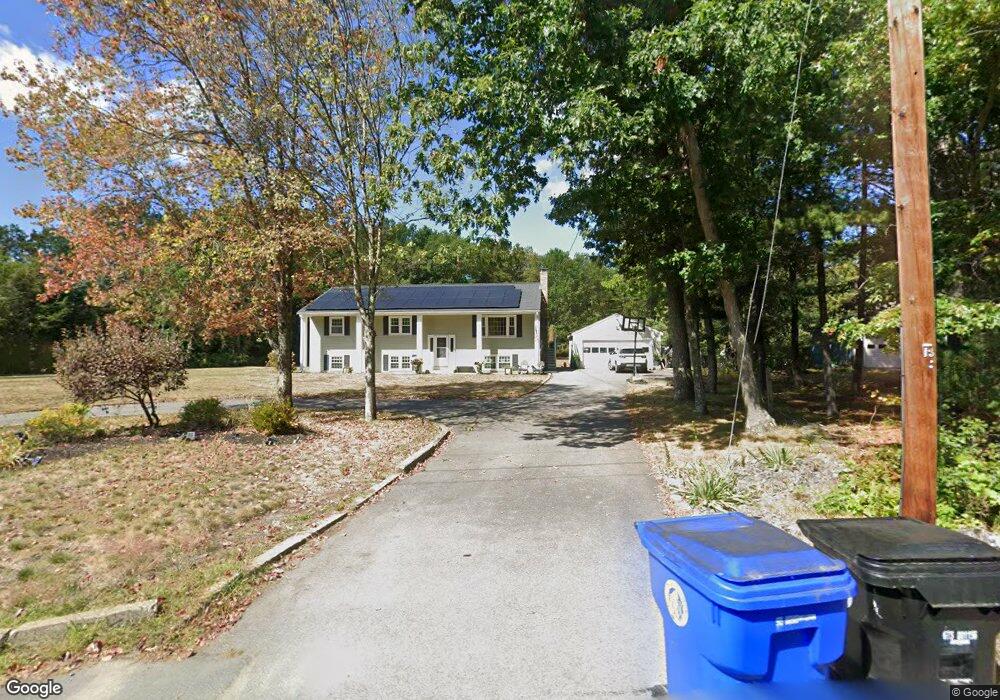
30 Peabody Rd Shirley, MA 01464
Estimated Value: $552,000 - $625,000
4
Beds
2
Baths
2,264
Sq Ft
$261/Sq Ft
Est. Value
About This Home
This home is located at 30 Peabody Rd, Shirley, MA 01464 and is currently estimated at $591,653, approximately $261 per square foot. 30 Peabody Rd is a home located in Middlesex County with nearby schools including Page Hilltop School, Lura A. White Elementary School, and Ayer Shirley Regional Middle School.
Ownership History
Date
Name
Owned For
Owner Type
Purchase Details
Closed on
Jul 13, 2009
Sold by
Sault Amy
Bought by
Filetti Salvatore
Current Estimated Value
Home Financials for this Owner
Home Financials are based on the most recent Mortgage that was taken out on this home.
Original Mortgage
$215,913
Interest Rate
4.93%
Mortgage Type
Purchase Money Mortgage
Purchase Details
Closed on
Mar 16, 2006
Sold by
Maroney Linda Ann and Tucker Robert C
Bought by
Sault Amy
Home Financials for this Owner
Home Financials are based on the most recent Mortgage that was taken out on this home.
Original Mortgage
$240,800
Interest Rate
6.27%
Mortgage Type
Purchase Money Mortgage
Purchase Details
Closed on
Jun 4, 2001
Sold by
Soucy Harold J and Soucy Kan Nan
Bought by
Tucker Robert C and Tucker Song Cha
Home Financials for this Owner
Home Financials are based on the most recent Mortgage that was taken out on this home.
Original Mortgage
$237,500
Interest Rate
7.09%
Mortgage Type
Purchase Money Mortgage
Create a Home Valuation Report for This Property
The Home Valuation Report is an in-depth analysis detailing your home's value as well as a comparison with similar homes in the area
Home Values in the Area
Average Home Value in this Area
Purchase History
| Date | Buyer | Sale Price | Title Company |
|---|---|---|---|
| Filetti Salvatore | $219,900 | -- | |
| Sault Amy | $344,000 | -- | |
| Tucker Robert C | $250,000 | -- |
Source: Public Records
Mortgage History
| Date | Status | Borrower | Loan Amount |
|---|---|---|---|
| Open | Tucker Robert C | $217,210 | |
| Closed | Filetti Salvatore | $215,913 | |
| Previous Owner | Sault Amy | $240,800 | |
| Previous Owner | Tucker Robert C | $237,500 |
Source: Public Records
Tax History Compared to Growth
Tax History
| Year | Tax Paid | Tax Assessment Tax Assessment Total Assessment is a certain percentage of the fair market value that is determined by local assessors to be the total taxable value of land and additions on the property. | Land | Improvement |
|---|---|---|---|---|
| 2025 | $60 | $462,200 | $133,300 | $328,900 |
| 2024 | $5,625 | $414,500 | $121,500 | $293,000 |
| 2023 | $5,101 | $359,700 | $121,500 | $238,200 |
| 2022 | $5,266 | $340,200 | $113,700 | $226,500 |
| 2021 | $5,414 | $327,500 | $101,900 | $225,600 |
| 2020 | $5,183 | $321,700 | $101,900 | $219,800 |
| 2019 | $5,144 | $319,900 | $101,900 | $218,000 |
| 2018 | $4,824 | $293,800 | $95,600 | $198,200 |
| 2017 | $4,787 | $289,800 | $98,000 | $191,800 |
| 2016 | $4,700 | $284,700 | $98,000 | $186,700 |
| 2015 | $4,127 | $238,400 | $86,200 | $152,200 |
Source: Public Records
Map
Nearby Homes
- 83 Clark Rd Unit 38
- 29 Clark Rd
- 16 Myles Ln
- 67 Front St
- 4 Hill Ln
- 40 Ayer Rd
- 30 Ayer Rd
- 7 Ambrose Way Unit 5
- 6 Ambrose Way Unit 3
- 17 Ambrose Way Unit 17
- 9 Ambrose Way Unit 9
- 5 Ambrose Way Unit 5
- 3 Ambrose Way Unit 3
- 53 Walker Rd
- 78 Walker Rd
- 3 Mill St
- 35 Fredonian St Unit K
- 4 Davis St
- 124 Hazen Rd
- 14 Cavite St
- 63 Wayside
- 65 Wayside Park
- 62 Wayside Park
- 32 Peabody Rd
- 26 Peabody Rd
- 31 Peabody Rd
- 29 Peabody Rd
- 22 Peabody Rd
- 25 Peabody Rd
- 36 Peabody Rd
- 53 Wayside Park
- 33 Peabody Rd
- 23 Peabody Rd
- 51 Wayside Park
- 20 Peabody Rd
- 37 Peabody Rd
- 162 Ayer Rd Unit H5
- 162 Ayer Rd Unit G5
- 162 Ayer Rd Unit F5
- 162 Ayer Rd Unit E5