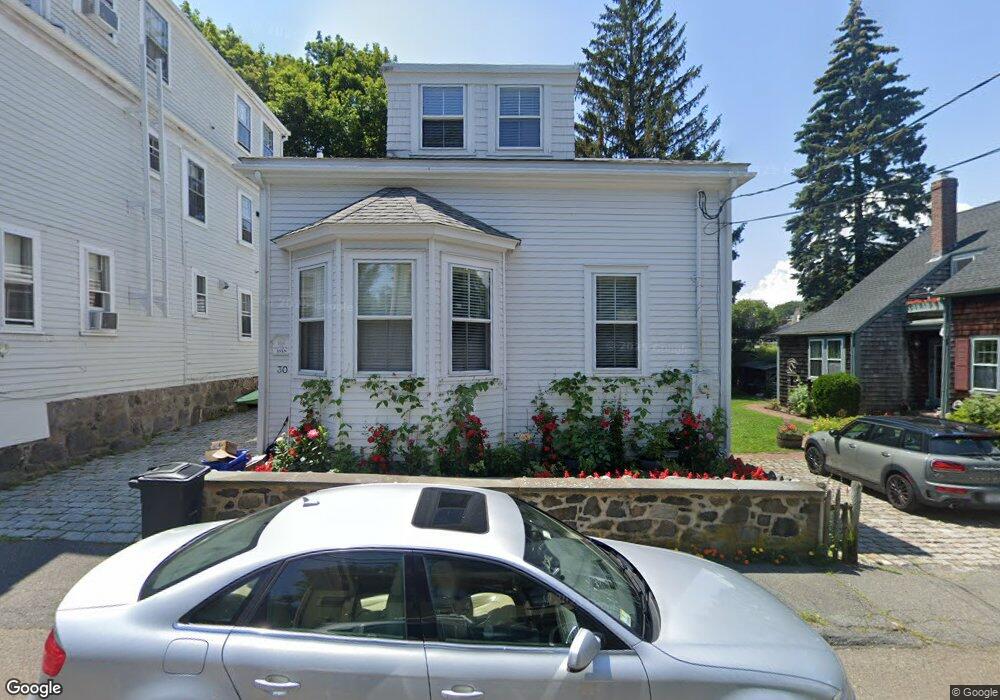
30 Pearl St Unit 1 Marblehead, MA 01945
Estimated Value: $819,000 - $1,035,000
3
Beds
2
Baths
1,559
Sq Ft
$612/Sq Ft
Est. Value
About This Home
This home is located at 30 Pearl St Unit 1, Marblehead, MA 01945 and is currently estimated at $954,020, approximately $611 per square foot. 30 Pearl St Unit 1 is a home located in Essex County with nearby schools including Marblehead High School, Marblehead Community Charter Public School, and Devereux School.
Ownership History
Date
Name
Owned For
Owner Type
Purchase Details
Closed on
Jun 15, 2012
Sold by
Soracco Theresa M
Bought by
Lavalle Terrence M and Lavalle Aline R
Current Estimated Value
Purchase Details
Closed on
Jun 14, 2010
Sold by
Rogers Arthur E
Bought by
Soracco Theresa M
Purchase Details
Closed on
Jul 23, 2004
Sold by
Ballard Gary N and Ballard Kimberley R
Bought by
Rogers Arthur E
Purchase Details
Closed on
Feb 15, 2002
Sold by
Tracy Lesley H
Bought by
Ballard Gary N and Ballard Kimberley R
Purchase Details
Closed on
Sep 18, 2000
Sold by
Carter Lisa E
Bought by
Tracy Lesley H
Purchase Details
Closed on
Jan 15, 1997
Sold by
Quinlan David J and Quinlan Johanna B
Bought by
Carter Lisa E
Purchase Details
Closed on
May 6, 1992
Sold by
Morris Carrie L
Bought by
Quinlan David J and Quinlan Johanna
Create a Home Valuation Report for This Property
The Home Valuation Report is an in-depth analysis detailing your home's value as well as a comparison with similar homes in the area
Home Values in the Area
Average Home Value in this Area
Purchase History
| Date | Buyer | Sale Price | Title Company |
|---|---|---|---|
| Lavalle Terrence M | $475,000 | -- | |
| Soracco Theresa M | $505,000 | -- | |
| Soracco Theresa M | $505,000 | -- | |
| Rogers Arthur E | $535,000 | -- | |
| Rogers Arthur E | $535,000 | -- | |
| Ballard Gary N | $395,000 | -- | |
| Tracy Lesley H | $357,000 | -- | |
| Tracy Lesley H | $357,000 | -- | |
| Carter Lisa E | $245,000 | -- | |
| Carter Lisa E | $245,000 | -- | |
| Quinlan David J | $191,500 | -- | |
| Quinlan David J | $191,500 | -- |
Source: Public Records
Mortgage History
| Date | Status | Borrower | Loan Amount |
|---|---|---|---|
| Previous Owner | Quinlan David J | $404,000 |
Source: Public Records
Tax History
| Year | Tax Paid | Tax Assessment Tax Assessment Total Assessment is a certain percentage of the fair market value that is determined by local assessors to be the total taxable value of land and additions on the property. | Land | Improvement |
|---|---|---|---|---|
| 2025 | $8,597 | $949,900 | $704,300 | $245,600 |
| 2024 | $8,339 | $930,700 | $704,300 | $226,400 |
| 2023 | $7,833 | $783,300 | $606,800 | $176,500 |
| 2022 | $7,691 | $731,100 | $541,800 | $189,300 |
| 2021 | $7,504 | $720,200 | $530,900 | $189,300 |
| 2020 | $7,010 | $674,700 | $520,100 | $154,600 |
| 2019 | $6,897 | $642,200 | $487,600 | $154,600 |
| 2018 | $6,480 | $588,000 | $433,400 | $154,600 |
| 2017 | $6,235 | $566,300 | $411,700 | $154,600 |
| 2016 | $5,805 | $523,000 | $368,400 | $154,600 |
| 2015 | $5,554 | $501,300 | $346,700 | $154,600 |
| 2014 | $5,384 | $485,500 | $346,700 | $138,800 |
Source: Public Records
Map
Nearby Homes
- 20 Mechanic Square Unit 3
- 20 Mechanic Square Unit 2
- 7 Mechanic Ct
- 3 Frost Ln Unit 1
- 45 Pleasant St
- 102 Front St Unit 1
- 75 Pond St
- 132 Elm St
- 132 Elm St Unit 132
- 7 Lee St Unit 3
- 66 Pleasant St Unit 1
- 66 Pleasant St Unit 2
- 55 Brackett Place Unit B
- 15 Lindsey St
- 290 Washington St Unit 1
- 2 Beacon Hill Rd
- 27 Village St Unit 1
- 55 Pitman Rd
- 1 Knollwood Rd
- 4 Ballast Ln
- 30 Pearl St
- 34 Pearl St
- 28 Pearl St
- 42 Elm St
- 38 Elm St
- 38 Elm St Unit 2
- 38 Elm St Unit 3
- 24R Pearl St Unit 4
- 24R Pearl St Unit R
- 24 Pearl St Unit 3
- 24 Pearl St Unit 2
- 24 Pearl St Unit 1
- 11 Mechanic Ct
- 27 Pearl St
- 22 Pearl St
- 36 Elm St
- 50 Elm St Unit ID1045441P
- 50 Elm St Unit 7
- 50 Elm St Unit 4
- 50 Elm St Unit 5