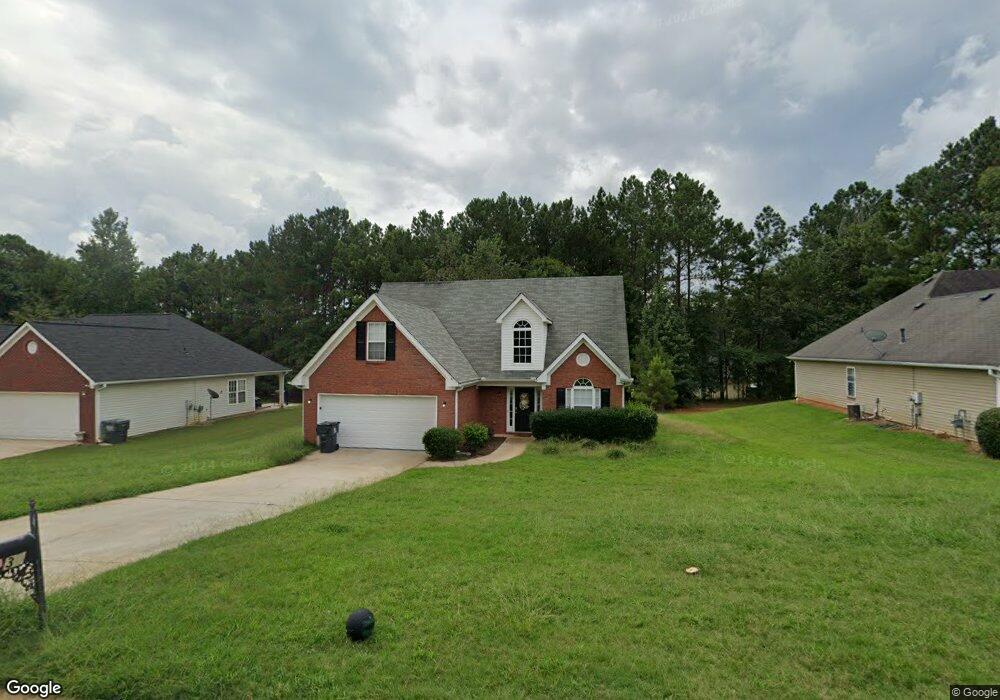
30 Pebble Brooke Ct Unit 3 Covington, GA 30016
Estimated Value: $262,322 - $292,000
4
Beds
3
Baths
1,784
Sq Ft
$155/Sq Ft
Est. Value
About This Home
This home is located at 30 Pebble Brooke Ct Unit 3, Covington, GA 30016 and is currently estimated at $277,331, approximately $155 per square foot. 30 Pebble Brooke Ct Unit 3 is a home located in Newton County with nearby schools including West Newton Elementary School, Liberty Middle School, and Newton High School.
Ownership History
Date
Name
Owned For
Owner Type
Purchase Details
Closed on
Nov 9, 2021
Sold by
Sfr Jv 1 Property Llc
Bought by
Sfr Jv 1 2021 1 Borrower Llc
Current Estimated Value
Purchase Details
Closed on
Oct 13, 2020
Sold by
Barrios Alfonso Mendez
Bought by
Sfr Jv 1 Property Llc
Purchase Details
Closed on
Mar 15, 2018
Sold by
Gray Teresa
Bought by
Barrios Alfonso Mendez
Home Financials for this Owner
Home Financials are based on the most recent Mortgage that was taken out on this home.
Original Mortgage
$131,100
Interest Rate
4.38%
Mortgage Type
New Conventional
Purchase Details
Closed on
Oct 31, 2002
Sold by
Mitchell-Massey Construction Co
Bought by
Gray Teresa
Home Financials for this Owner
Home Financials are based on the most recent Mortgage that was taken out on this home.
Original Mortgage
$132,450
Interest Rate
5.95%
Mortgage Type
VA
Create a Home Valuation Report for This Property
The Home Valuation Report is an in-depth analysis detailing your home's value as well as a comparison with similar homes in the area
Home Values in the Area
Average Home Value in this Area
Purchase History
| Date | Buyer | Sale Price | Title Company |
|---|---|---|---|
| Sfr Jv 1 2021 1 Borrower Llc | -- | -- | |
| Sfr Jv 1 Property Llc | $178,000 | -- | |
| Barrios Alfonso Mendez | $138,000 | -- | |
| Gray Teresa | $129,900 | -- |
Source: Public Records
Mortgage History
| Date | Status | Borrower | Loan Amount |
|---|---|---|---|
| Previous Owner | Barrios Alfonso Mendez | $131,100 | |
| Previous Owner | Gray Teresa | $132,450 |
Source: Public Records
Tax History Compared to Growth
Tax History
| Year | Tax Paid | Tax Assessment Tax Assessment Total Assessment is a certain percentage of the fair market value that is determined by local assessors to be the total taxable value of land and additions on the property. | Land | Improvement |
|---|---|---|---|---|
| 2024 | $2,753 | $102,000 | $15,338 | $86,662 |
| 2023 | $3,172 | $114,800 | $7,600 | $107,200 |
| 2022 | $2,132 | $76,440 | $7,600 | $68,840 |
| 2021 | $2,117 | $67,920 | $7,600 | $60,320 |
| 2020 | $2,010 | $58,160 | $7,600 | $50,560 |
| 2019 | $1,913 | $54,440 | $7,600 | $46,840 |
| 2018 | $1,806 | $50,960 | $7,600 | $43,360 |
| 2017 | $1,810 | $51,080 | $7,600 | $43,480 |
| 2016 | $1,611 | $45,280 | $4,000 | $41,280 |
| 2015 | $1,404 | $39,760 | $4,000 | $35,760 |
| 2014 | $1,212 | $34,280 | $0 | $0 |
Source: Public Records
Map
Nearby Homes
- 30 Pebble Brooke Ct
- 20 Pebble Brooke Ct Unit 1
- 50 Pebble Brooke Ct Unit 50
- 50 Pebble Brooke Ct
- 690 Pebble Blvd
- 620 Pebble Blvd
- 630 Pebble Blvd Unit 1
- 610 Pebble Blvd
- 35 Pebble Brooke Ct
- 660 Pebble Blvd
- 25 Pebble Brooke Ct
- 45 Pebble Brooke Ct
- 60 Pebble Brooke Ct Unit 6
- 60 Pebble Brooke Ct
- 60 Pebble Brooke Ct Unit 1
- 600 Pebble Blvd
- 55 Pebble Brooke Ct
- 710 Pebble Blvd
- 590 Pebble Blvd
- 70 Pebble Brooke Ct